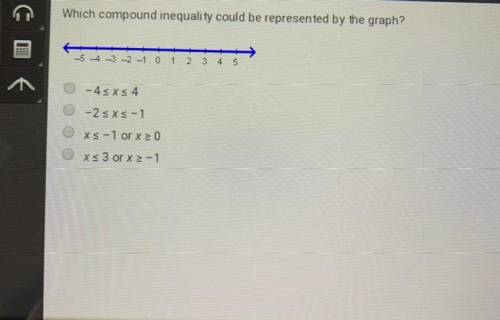
Which compound inequality could be represented by the graph?
-5 4 -3 -2 -1 0 1 2
3 4
5<...

Mathematics, 29.01.2021 21:20 barkonatree
Which compound inequality could be represented by the graph?
-5 4 -3 -2 -1 0 1 2
3 4
5
-4sxs4
-2
xs-1 or x>0
x 3 or x>-1

Answers: 1


Other questions on the subject: Mathematics
Mathematics, 21.06.2019 19:30, tyeni2crazylolp7a3hk
If chord ab is congruent to chord cd, then what must be true about ef and eg?
Answers: 1
Mathematics, 21.06.2019 20:30, cupcake20019peehui
Kai walked one and two-thirds of a mile on saturday and four and one-sixth of a mile on sunday. how many miles did kai walk?
Answers: 1
Mathematics, 21.06.2019 21:30, xaguilar
Data from 2005 for various age groups show that for each $100 increase in the median weekly income for whites, the median weekly income of blacks increases by $105. also, for workers of ages 25 to 54 the median weekly income for whites was $676 and for blacks was $527. (a) let w represent the median weekly income for whites and b the median weekly income for blacks, and write the equation of the line that gives b as a linear function of w. b = (b) when the median weekly income for whites is $760, what does the equation in (a) predict for the median weekly income for blacks?
Answers: 2
You know the right answer?
Questions in other subjects:
Mathematics, 01.07.2020 15:01


