
Mathematics, 29.01.2021 05:00 jenn8055
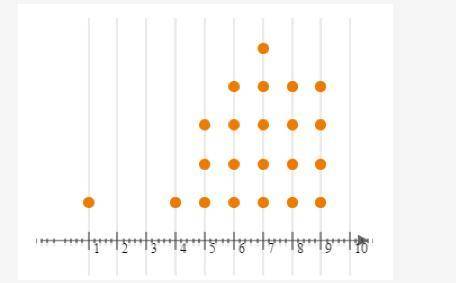
The data for numbers of times per week 22 students at Diggamole High eat fruit are shown below:
Part A: Describe the dotplot.
Part B: What, if any, are the outliers in these data? Show your work.
Part C: What is the best measure of center for these data? Explain your reasoning.

Answers: 3


Other questions on the subject: Mathematics
Mathematics, 21.06.2019 19:30, MariaIZweird7578
Combine the information in the problem and the chart using the average balance method to solve the problem.
Answers: 2
Mathematics, 21.06.2019 20:40, kaylabethany
How is the equation of this circle written in standard form? x2 + y2 - 6x + 14y = 142 a) (x - 3)2 + (y + 7)2 = 200 b) (x+ 3)2 + (y - 7)2 = 200 (x - 6)2 + (y + 14)2 = 142 d) (x+6)2 + (y- 14)2 = 142
Answers: 1
Mathematics, 21.06.2019 23:00, jayjay2006
What is the value of n in the equation -1/2(2n+4)+6=-9+4(2n+1)
Answers: 1
You know the right answer?
The data for numbers of times per week 22 students at Diggamole High eat fruit are shown below:
Par...
Questions in other subjects:


Business, 11.04.2021 23:10


English, 11.04.2021 23:10


