
Mathematics, 28.01.2021 23:40 dayanawhite64
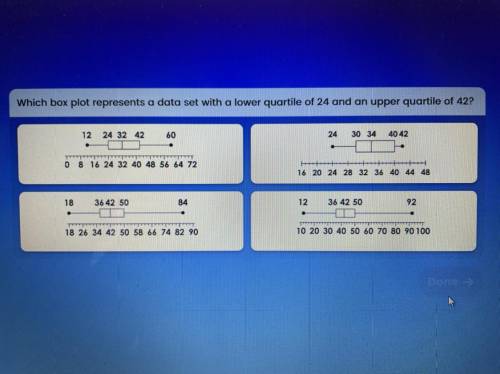
Which box plot represents a data set with a lower quartile of 24 and an upper quartile of 42?
12
24 32 42
60
24
30 34
40 42
-
0 8 16 24 32 40 48 56 64 72
16 20 24 28 32 36 40 44 48
18
36 42 50
84
12
36 42 50
92
18 26 34 42 50 58 66 74 82 90
10 20 30 40 50 60 70 80 90 100

Answers: 2


Other questions on the subject: Mathematics
Mathematics, 21.06.2019 15:30, sweetgigi5950
Sunday: 1 1 2 monday: 1 tuesday: 2 1 2 wednesday: 1 3 4 thursday: 2 friday: 1 1 2 saturday: 2 jenna is a swimmer and trains every day. the schedule shown outlines the number of hours she trains each day. what is the total number of hours that jenna trains during the week?
Answers: 3
Mathematics, 21.06.2019 19:00, naomicervero
Four individuals pool money together to start a new business and agree to split the profits equally. n invests $6,000, x invests $2,000, y invests $8,000 and z invests $4,000. if the profits for the first month were $100,000, y receives than if the profits were divided in proportion to how much they invested.
Answers: 3
You know the right answer?
Which box plot represents a data set with a lower quartile of 24 and an upper quartile of 42?
12
Questions in other subjects:
Mathematics, 25.02.2021 16:30

Business, 25.02.2021 16:30

History, 25.02.2021 16:30
Mathematics, 25.02.2021 16:30

English, 25.02.2021 16:30

Arts, 25.02.2021 16:30

Social Studies, 25.02.2021 16:30
Mathematics, 25.02.2021 16:30


