
Mathematics, 28.01.2021 20:50 DjPeaceQueen
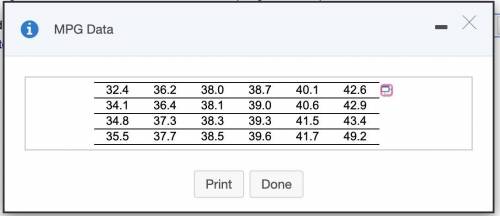
The accompanying data represent the miles per gallon of a random sample of cars with a three-cylinder, 1.0 liter engine.
(a) Compute the z-score corresponding to the individual who obtained 34.1 miles per gallon. Interpret this result.
(b) Determine the quartiles.
(c) Compute and interpret the interquartile range, IQR.
(d) Determine the lower and upper fences. Are there any outliers?

Answers: 1


Other questions on the subject: Mathematics
Mathematics, 21.06.2019 14:30, thnguyen0720
Find all the values of x that make 0.1x + 0.25(102 - x) < 17.10 true.
Answers: 1
Mathematics, 21.06.2019 20:30, janeou17xn
Peter applied to an accounting firm and a consulting firm. he knows that 30% of similarly qualified applicants receive job offers from the accounting firm, while only 20% of similarly qualified applicants receive job offers from the consulting firm. assume that receiving an offer from one firm is independent of receiving an offer from the other. what is the probability that both firms offer peter a job?
Answers: 1
You know the right answer?
The accompanying data represent the miles per gallon of a random sample of cars with a three-cylinde...
Questions in other subjects:
Mathematics, 06.02.2021 05:20
Mathematics, 06.02.2021 05:20
Mathematics, 06.02.2021 05:20


Mathematics, 06.02.2021 05:20
Biology, 06.02.2021 05:20


