
Mathematics, 28.01.2021 16:00 Ididntwanttomakethis
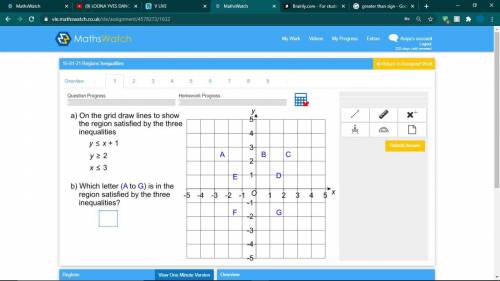
On the grid draw lines to show the region satisfied by the three inequalities y ≤ x+1 y ≥ 2 x ≤ 3

Answers: 2


Other questions on the subject: Mathematics
Mathematics, 21.06.2019 18:30, FailingstudentXD
Do some research and find a city that has experienced population growth. determine its population on january 1st of a certain year. write an exponential function to represent the city’s population, y, based on the number of years that pass, x after a period of exponential growth. describe the variables and numbers that you used in your equation.
Answers: 3
Mathematics, 21.06.2019 20:00, Queenashley3232
Combine like terms to make a simpler expression 3z+z
Answers: 2
Mathematics, 21.06.2019 20:10, tiggyandrep2dbee
Look at the hyperbola graphed below. the hyperbola gets very close to the red lines on the graph, but it never touches them. which term describes each of the red lines? o o o o a. asymptote b. directrix c. focus d. axis
Answers: 3
You know the right answer?
On the grid draw lines to show the region satisfied by the three inequalities y ≤ x+1 y ≥ 2 x ≤ 3
Questions in other subjects:
Mathematics, 29.05.2021 14:00

Health, 29.05.2021 14:00

History, 29.05.2021 14:00


Business, 29.05.2021 14:00

Social Studies, 29.05.2021 14:00
Social Studies, 29.05.2021 14:00


