
Mathematics, 28.01.2021 14:00 rrojassaucedo
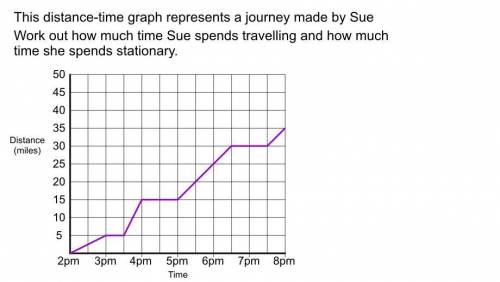
This distance time graph represents a journey made by Sue.
Work out how much time Sue spends travelling and how much time she spends stationary.
If, this doesn't make sense then see picture attached.
Please help me

Answers: 3


Other questions on the subject: Mathematics
Mathematics, 21.06.2019 18:00, alyssatamayo641
What is the solution of log2 (3x - 7) = 3? 4 5
Answers: 1
Mathematics, 21.06.2019 19:30, genyjoannerubiera
Each cookie sells for $0.50 sam spent $90 on baking supplies and each cookie cost $0.25 to make how many cookies does sam need to sell before making a profit formula: sales> cost
Answers: 1
Mathematics, 21.06.2019 20:30, kaliyaht01
The frequency table shows the results of a survey comparing the number of beach towels sold for full price and at a discount during each of the three summer months. the store owner converts the frequency table to a conditional relative frequency table by row. which value should he use for x? round to the nearest hundredth. 0.89 0.90 0.92 0.96
Answers: 2
Mathematics, 21.06.2019 22:20, jimena15
As voters exit the polls, you ask a representative random sample of voters if they voted for a proposition. if the true percentage of voters who vote for the proposition is 63%, what is the probability that, in your sample, exactly 5 do not voted for the proposition before 2 voted for the proposition? the probability is
Answers: 2
You know the right answer?
This distance time graph represents a journey made by Sue.
Work out how much time Sue spends travel...
Questions in other subjects:


Mathematics, 27.04.2020 02:29
English, 27.04.2020 02:29

Physics, 27.04.2020 02:29
Mathematics, 27.04.2020 02:29

Social Studies, 27.04.2020 02:29

Biology, 27.04.2020 02:29

History, 27.04.2020 02:29


