The diagram below shows how much
time John spends doing different
activities each day.
...

Mathematics, 28.01.2021 06:20 ineedhelp2285
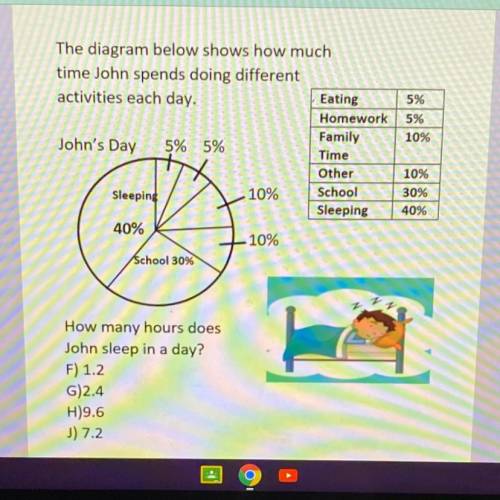
The diagram below shows how much
time John spends doing different
activities each day.
Eating
Homework
Family
John's Day 5% 5%
Time
Other
10% School
Sleeping
40%
5%
5%
10%
Sleeping
10%
30%
40%
+10%
School 30%
How many hours does
John sleep in a day?
F) 1.2
G)2.4
H)9.6
J) 7.2

Answers: 3


Other questions on the subject: Mathematics
Mathematics, 21.06.2019 18:50, firenation18
The table represents a function. what is f(-2)? a.-3 b. -1 c.1 d.3
Answers: 1
Mathematics, 21.06.2019 20:30, marahkotelman
Arectangle has a width of 5 cm and a length of 10 cm. if the width is increased by 3, how does the perimeter change?
Answers: 1
Mathematics, 21.06.2019 22:00, gamallopatty
If i had 1234 apples and 1 banana what is the total amount
Answers: 2
You know the right answer?
Questions in other subjects:


English, 21.08.2021 04:00
History, 21.08.2021 04:00


