Design a Roller Coaster Portfolio
ALGEBRA 2 A: FUNCTIONS, EQUATIONS, AND GRAPHS
Introduction:...

Mathematics, 28.01.2021 02:10 rosieposie27
Design a Roller Coaster Portfolio
ALGEBRA 2 A: FUNCTIONS, EQUATIONS, AND GRAPHS
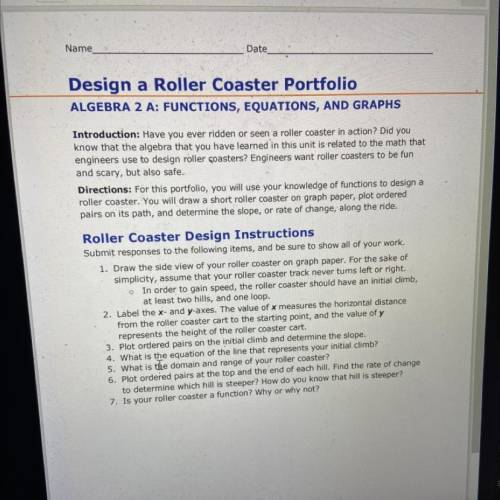
Introduction: Have you ever ridden or seen a roller coaster in action? Did you
know that the algebra that you have learned in this unit is related to the math that
engineers use to design roller coasters? Engineers want roller coasters to be fun
and scary, but also safe.
Directions: For this portfolio, you will use your knowledge of functions to design a
roller coaster. You will draw a short roller coaster on graph paper, plot ordered
pairs on its path, and determine the slope, or rate of change, along the ride.
Roller Coaster Design Instructions
Submit responses to the following items, and be sure to show all of your work.
1. Draw the side view of your roller coaster on graph paper. For the sake of
simplicity, assume that your roller coaster track never turns left or right.
o In order to gain speed, the roller coaster should have an initial climb,
at least two hills, and one loop.
2. Label the x- and y-axes. The value of x measures the horizontal distance
from the roller coaster cart to the starting point, and the value of y
represents the height of the roller coaster cart.
3. Plot ordered pairs on the initial climb and determine the slope.
4. What is the equation of the line that represents your initial climb?
5. What is the domain and range of your roller coaster?
6. Plot ordered pairs at the top and the end of each hill. Find the rate of change
to determine which hill is steeper? How do you know that hill is steeper?
7. Is your roller coaster a function? Why or why not?

Answers: 3


Other questions on the subject: Mathematics
Mathematics, 21.06.2019 15:30, makaylapink8167
The tiles below are pieces of a normal ecg tracing representing a little less than two heartbeats at a resting rate of 80 bpm. arrange the tiles in their correct order. rank from first to last. do not overlap any tiles.
Answers: 1
Mathematics, 21.06.2019 20:10, Maddi7328
The graph and table shows the relationship between y, the number of words jean has typed for her essay and x, the number of minutes she has been typing on the computer. according to the line of best fit, about how many words will jean have typed when she completes 60 minutes of typing? 2,500 2,750 3,000 3,250
Answers: 1
Mathematics, 21.06.2019 23:40, Alex9089435028
You are saving to buy a bicycle; so far you save 55.00. the bicycle costs 199.00. you earn 9.00 per hour at your job. which inequality represents the possible number of h hours you need to work to buy the bicycle?
Answers: 2
You know the right answer?
Questions in other subjects:

Biology, 24.06.2020 19:01


History, 24.06.2020 19:01


