
Mathematics, 28.01.2021 01:30 hopp
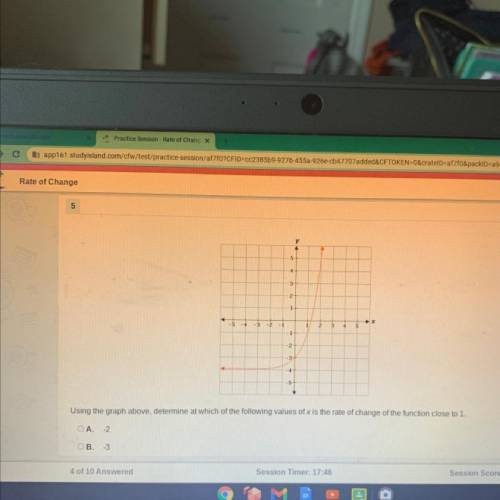
Please help me guys I don’t want to fail using the graph above, determine at which of the following values of x is the rate of change of the function close to 1
A. -2
B. -3
C. 1
D. 0

Answers: 3


Other questions on the subject: Mathematics
Mathematics, 21.06.2019 18:00, babydolltia28
Is a positive integer raised to a negative power always positive
Answers: 1
Mathematics, 21.06.2019 19:10, smarty5187
If $740 is invested at an interest rate of 11% per year and is compounded continuously, how much will the investment be worth in 7 years? use the continuous compound interest formula a = pert.
Answers: 1
Mathematics, 21.06.2019 20:00, dathanboyd
Cody started biking to the park traveling 15 mph, after some time the bike got a flat so cody walked the rest of the way, traveling 4 mph. if the total trip to the park took 6 hours and it was 46 miles away, how long did cody travel at each speed? solve using rate times time= distance
Answers: 1
You know the right answer?
Please help me guys I don’t want to fail using the graph above, determine at which of the following...
Questions in other subjects:
Mathematics, 30.04.2021 01:50

Biology, 30.04.2021 01:50


History, 30.04.2021 01:50

English, 30.04.2021 01:50
Mathematics, 30.04.2021 01:50


