
Mathematics, 27.01.2021 20:30 csnow
Two cities are 36 miles apart. Given the distance between the cities on each map, find the scale of each map coparing inches to miles.

Answers: 2


Other questions on the subject: Mathematics
Mathematics, 21.06.2019 23:00, janeou17xn
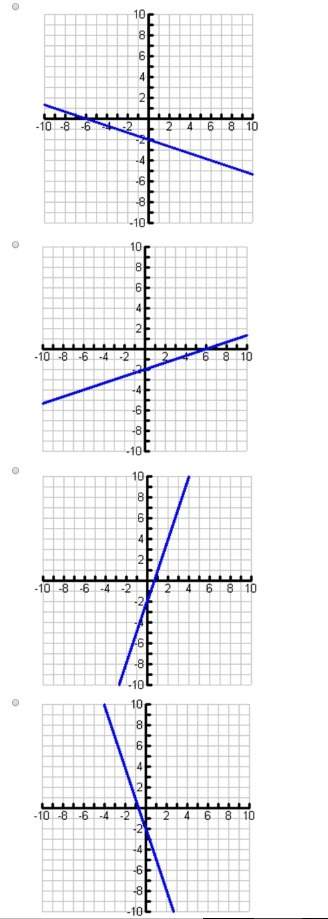
The equation shown below represents function f. f(x)= -2x+5 the graph shown below represents function g. which of the following statements is true? a. over the interval [2, 4], the average rate of change of f is the same as the average rate of change of g. the y-intercept of function f is less than the y-intercept of function g. b. over the interval [2, 4], the average rate of change of f is greater than the average rate of change of g. the y-intercept of function f is greater than the y-intercept of function g. c. over the interval [2, 4], the average rate of change of f is the same as the average rate of change of g. the y-intercept of function f is greater than the y-intercept of function g. d. over the interval [2, 4], the average rate of change of f is less than the average rate of change of g. the y-intercept of function f is the same as the y-intercept of function g.
Answers: 1
Mathematics, 22.06.2019 03:00, dominiqueallen23
Describe how the presence of possible outliers might be identified on the following. (a) histograms gap between the first bar and the rest of bars or between the last bar and the rest of bars large group of bars to the left or right of a gap higher center bar than surrounding bars gap around the center of the histogram higher far left or right bar than surrounding bars (b) dotplots large gap around the center of the data large gap between data on the far left side or the far right side and the rest of the data large groups of data to the left or right of a gap large group of data in the center of the dotplot large group of data on the left or right of the dotplot (c) stem-and-leaf displays several empty stems in the center of the stem-and-leaf display large group of data in stems on one of the far sides of the stem-and-leaf display large group of data near a gap several empty stems after stem including the lowest values or before stem including the highest values large group of data in the center stems (d) box-and-whisker plots data within the fences placed at q1 â’ 1.5(iqr) and at q3 + 1.5(iqr) data beyond the fences placed at q1 â’ 2(iqr) and at q3 + 2(iqr) data within the fences placed at q1 â’ 2(iqr) and at q3 + 2(iqr) data beyond the fences placed at q1 â’ 1.5(iqr) and at q3 + 1.5(iqr) data beyond the fences placed at q1 â’ 1(iqr) and at q3 + 1(iqr)
Answers: 1
Mathematics, 22.06.2019 04:30, alisucaalisuca
What states a rule using variables expression term or formula
Answers: 1
Mathematics, 22.06.2019 07:10, abbypark0804
The graph of f(x)= 3•2^x-3 is shown below. g(x) is a transformation of f(x)
Answers: 1
You know the right answer?
Two cities are 36 miles apart. Given the distance between the cities on each map, find the scale of...
Questions in other subjects:
Mathematics, 12.05.2021 20:00

English, 12.05.2021 20:00
Mathematics, 12.05.2021 20:00
Mathematics, 12.05.2021 20:00
Mathematics, 12.05.2021 20:00

Social Studies, 12.05.2021 20:00
Mathematics, 12.05.2021 20:00

Mathematics, 12.05.2021 20:00


