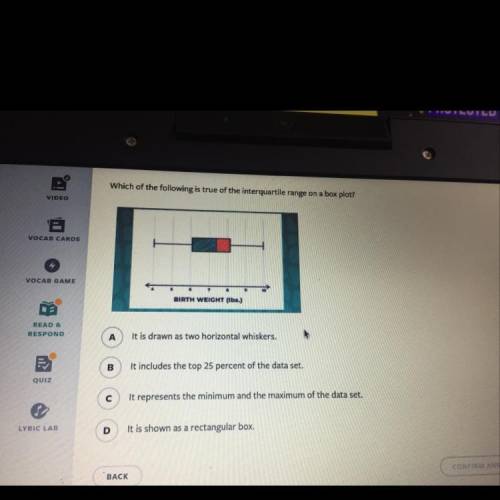
Which of the following is true of the interquartile range on a box plot?
A
It is drawn as two...

Mathematics, 27.01.2021 20:00 tanyalaurenti
Which of the following is true of the interquartile range on a box plot?
A
It is drawn as two horizontal whiskers.
B
It includes the top 25 percent of the data set.
с
It represents the minimum and the maximum of the data set.
D
It is shown as a rectangular box.

Answers: 3


Other questions on the subject: Mathematics
Mathematics, 21.06.2019 16:00, SavyBreyer
Use the function f(x) is graphed below. the graph of the function to find, f(6). -2 -1 1 2
Answers: 1
Mathematics, 21.06.2019 18:30, victoria6929
Which of the choices shown could be used to prove that aacp=abcp ?
Answers: 1
Mathematics, 21.06.2019 18:30, zovav1oszg9z
Analyze the graph of the cube root function shown on the right to determine the transformations of the parent function. then, determine the values of a, h, and k in the general equation.
Answers: 1
You know the right answer?
Questions in other subjects:


Arts, 15.07.2019 14:30

Arts, 15.07.2019 14:30
Arts, 15.07.2019 14:30
Arts, 15.07.2019 14:30
Arts, 15.07.2019 14:30


