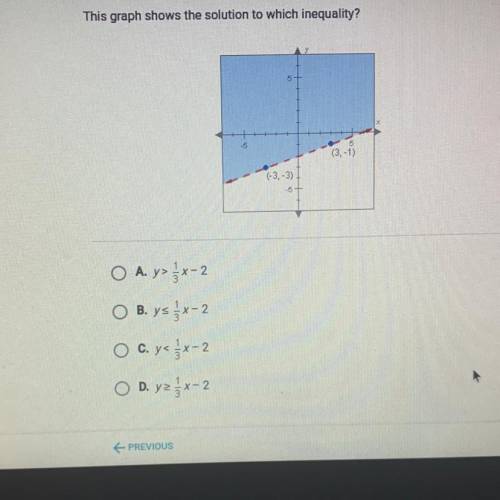
This graph shows the solution to which inequality?
(3,-1)
(-3,-3)
A y > 1/3x-2
...

Mathematics, 27.01.2021 18:00 oofoofoof1
This graph shows the solution to which inequality?
(3,-1)
(-3,-3)
A y > 1/3x-2
B. y< 1/3 x-2
C. y < 1/3x - 2
D. y> 1/3 x - 2

Answers: 3


Other questions on the subject: Mathematics
Mathematics, 21.06.2019 17:30, bradleycawley02
Lems1. the following data set represents the scores on intelligence quotient(iq) examinations of 40 sixth-grade students at a particular school: 114, 122, 103, 118, 99, 105, 134, 125, 117, 106, 109, 104, 111, 127,133, 111, 117, 103, 120, 98, 100, 130, 141, 119, 128, 106, 109, 115,113, 121, 100, 130, 125, 117, 119, 113, 104, 108, 110, 102(a) present this data set in a frequency histogram.(b) which class interval contains the greatest number of data values? (c) is there a roughly equal number of data in each class interval? (d) does the histogram appear to be approximately symmetric? if so, about which interval is it approximately symmetric?
Answers: 3
Mathematics, 21.06.2019 21:30, InvictusPain4777
Yo need asap pls ! markin da brainiest too !
Answers: 1
You know the right answer?
Questions in other subjects:


