
Mathematics, 27.01.2021 08:40 makennahudson94
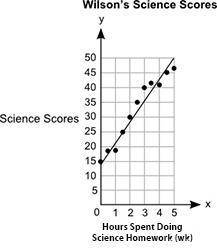
The graph shows Wilson's science scores versus the number of hours spent doing science homework. A graph titled Wilsons Science Scores shows Hours of Practice in a Week on x axis and Science Scores on y axis. The x axis scale is shown from 0 to 5 at increments of 1, and the y axis scale is shown from 0 to 50 at increments of 5.The ordered pairs 0, 15 and 0.5, 18 and 1, 18 and 1.5, 25 and 2, 30 and 2.5, 35 and 3, 40 and 3.5, 43 and 4, 41 and 4.5, 45 and 5, 48 are shown on the graph. A straight line joins the ordered pairs 0, 14.9 and 5, 50. What will most likely be Wilson's approximate science score if he does science homework for 6 hours a week? 33 points 42 points 52 points 55 points

Answers: 3


Other questions on the subject: Mathematics
Mathematics, 21.06.2019 18:00, puppylover72
Solve this and show you’re work step by step ! -5 3/4+3h< 9 1/4 -
Answers: 1
Mathematics, 21.06.2019 23:30, allisonlillian
The product of sin 30 degrees and sin 60 degrees is same as the product of
Answers: 1
You know the right answer?
The graph shows Wilson's science scores versus the number of hours spent doing science homework. A g...
Questions in other subjects:
Mathematics, 27.01.2021 17:20
Mathematics, 27.01.2021 17:20

Mathematics, 27.01.2021 17:20
Mathematics, 27.01.2021 17:20


