
Mathematics, 27.01.2021 08:40 evanwall91
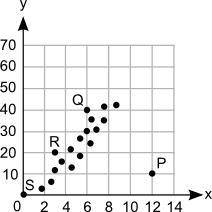
Which point on the scatter plot is an outlier? A graph shows scale on x axis from 0 to 14 at increments of 2 and a scale on y axis from 0 to 70 at increments of 10. Dots are made at ordered pairs 0, 0 and 1.8, 5 and 2.3, 9 and 2.8, 11 and 3.5, 15 and 4.1, 22 and 4.2, 26 and 5.5, 18 and 5.8, 29 and 6, 30 and 6.1, 15 and 6.5, 32 and 7.2, 35 and 7.3, 38 and 8.5, 42. The point 12, 10 is labeled as P, the point 6, 40 is labeled as Q, the point 3, 20 is labeled as R, and the point 0, 0 is labeled as S. Point P Point Q Point R Point S

Answers: 1


Other questions on the subject: Mathematics
Mathematics, 21.06.2019 13:00, cookies1164
What is the maximum total area that 450cm of string can enclose if it is used to form perimeters of two adjoining rectangles as shown?
Answers: 1
Mathematics, 22.06.2019 02:20, FaygoMango
If wxyz is a square, which statements must be true?
Answers: 1
You know the right answer?
Which point on the scatter plot is an outlier? A graph shows scale on x axis from 0 to 14 at increme...
Questions in other subjects:

English, 06.06.2020 06:57

English, 06.06.2020 06:57


German, 06.06.2020 06:57

Mathematics, 06.06.2020 06:57
Mathematics, 06.06.2020 06:57


