
Mathematics, 27.01.2021 04:30 honestty21
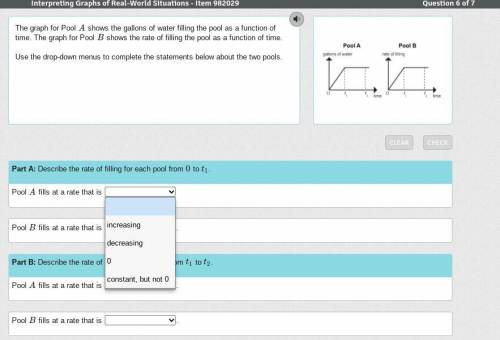
The graph for Pool A shows the gallons of water filling the pool as a function of time. The graph for Pool B shows the rate of filling the pool as a function of time. Use the drop-down menus to complete the statements below about the two pools.

Answers: 1


Other questions on the subject: Mathematics
Mathematics, 21.06.2019 16:30, sierrabuckner645
Which of the following is the correct ratio for converting kilograms to grams
Answers: 3
Mathematics, 21.06.2019 20:00, duhitzmay4693
The scatterplot below shows the number of hours that students read weekly and the number of hours that they spend on chores weekly. which statement about the scatterplot is true?
Answers: 2
Mathematics, 21.06.2019 20:00, sahaitong2552
Write each of the following numerals in base 10. for base twelve, t and e represent the face values ten and eleven, respectively. 114 base 5 89t base 12
Answers: 1
You know the right answer?
The graph for Pool A shows the gallons of water filling the pool as a function of time. The graph fo...
Questions in other subjects:
Mathematics, 22.10.2020 06:01

English, 22.10.2020 06:01
Mathematics, 22.10.2020 06:01
Mathematics, 22.10.2020 06:01

English, 22.10.2020 06:01


