
Mathematics, 26.01.2021 20:20 leahelixabeth8973
Question Help
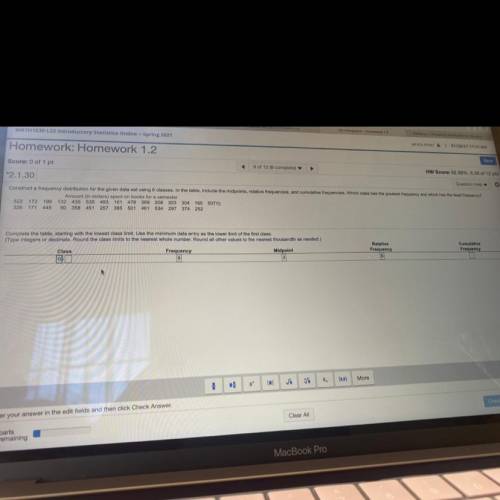
Construct a frequency distribution for the given data set using 6 classes. In the table, include the midpoints, relative frequencies, and cumulative frequencies. Which class has the greatest frequency and which has the least frequency
Amount (in dollars) spent on books for a semester
522 172 199 132 435 535 493 161 478 369 208 323 304 165 507
326 171 445 50 358 451 257 385 501 461 534 297 374 252
Complete the table, starting with the lowest class limit. Use the minimum data entry as the lower limit of the first class.
(Type integers or decimals. Round the class limits to the nearest whole number. Round all other values to the nearest thousandth as needed.)
Class
Midpoint
OHI
Relative
Frequency
Cumulative
Frequency
Frequency

Answers: 2


Other questions on the subject: Mathematics
Mathematics, 21.06.2019 16:30, macenzie26
What could explain what happened when the time was equal to 120 minutes
Answers: 2
Mathematics, 21.06.2019 21:50, rubieceleste548
Rachel is studying the population of a particular bird species in a national park. she observes every 10th bird of that species that she can find in the park. her conclusion is that the birds living in the park who belong to that species generally feed on insects. rachel's sample is . based on the sample she picked, rachel's generalization is . reset next
Answers: 1
You know the right answer?
Question Help
Construct a frequency distribution for the given data set using 6 classes. In the tab...
Questions in other subjects:

Mathematics, 21.11.2019 20:31


History, 21.11.2019 20:31


