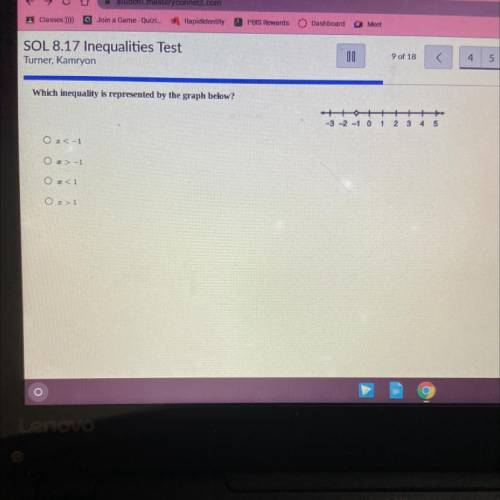
Which inequality is represented by the graph below?
++
+
-3 -2 -1 0 1 2 3 4 5
OI&...

Mathematics, 26.01.2021 19:40 hunterwilliams375
Which inequality is represented by the graph below?
++
+
-3 -2 -1 0 1 2 3 4 5
OI< -1
O >-1
O<1
O>

Answers: 2


Other questions on the subject: Mathematics
Mathematics, 21.06.2019 16:30, jayjay5246
Translate this phrase into an algebraic expression. 21 more than twice goran's savings use the variable g to represent goran's savings. need to know fast.
Answers: 1
You know the right answer?
Questions in other subjects:

English, 16.09.2019 22:30

Mathematics, 16.09.2019 22:30
Mathematics, 16.09.2019 22:30
History, 16.09.2019 22:30

Advanced Placement (AP), 16.09.2019 22:30
Mathematics, 16.09.2019 22:30

Biology, 16.09.2019 22:30
History, 16.09.2019 22:30


