
Mathematics, 30.01.2020 14:53 kutiracing
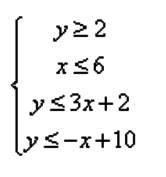
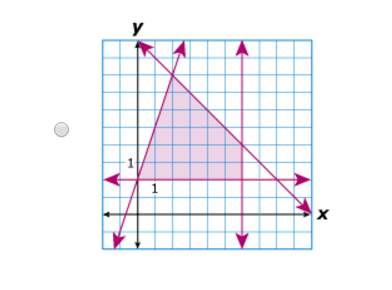
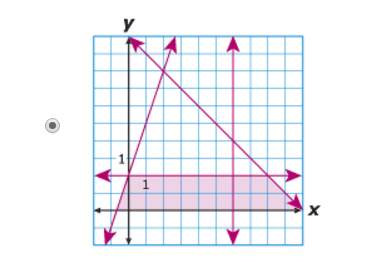
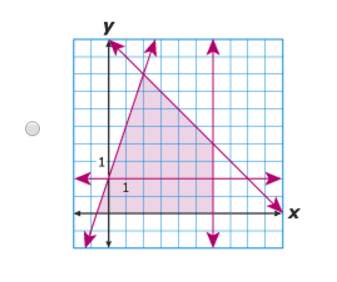
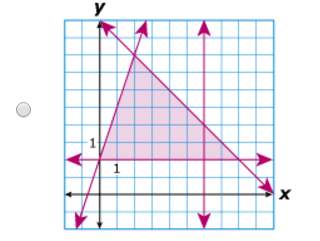
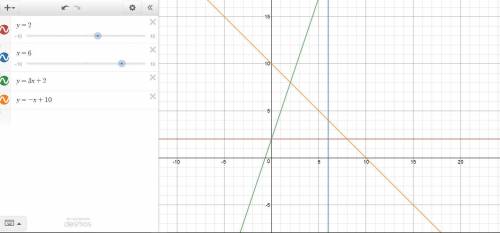
Which graph best represents the feasibility region for the system shown above? ( pics are in this)

Answers: 2


Other questions on the subject: Mathematics
Mathematics, 21.06.2019 16:00, Xghoued2056
Apark is in the shape of a rectangle. the park authorities are planning to build a 2-meter-wide jogging path in the park (shown as the shaded region in the image). what is the area of the jogging path? plz
Answers: 1
Mathematics, 21.06.2019 18:30, anishivaturi123
Select the lengths in centimeters that would form a right triangle
Answers: 1
You know the right answer?
Which graph best represents the feasibility region for the system shown above? ( pics are in this)<...
Questions in other subjects:

Mathematics, 11.03.2021 16:20
Mathematics, 11.03.2021 16:20

English, 11.03.2021 16:20
English, 11.03.2021 16:20


