
Mathematics, 25.01.2021 23:00 ehklu1226
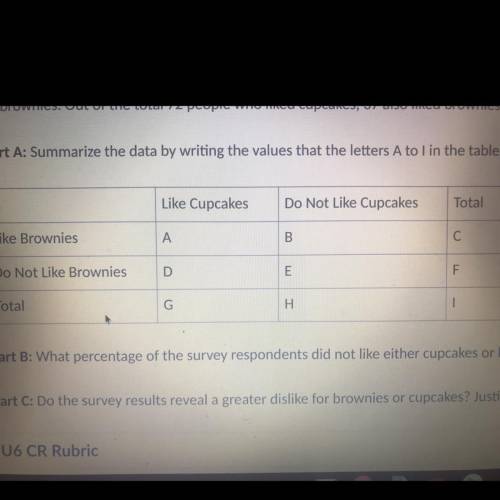
A bakery did a survey among 100 customers to find their food preference . The customers were asked about their preferences for cupcakes or brownies. Out of the total 72 people who liked cupcakes, 37 also liked brownies. There were 59 people who liked brownies.
Part A. Summarize the data by writing the values that the letters A to I in the table below represents
PART B. What percentage of the survey respondents did not like cupcakes or brownies ?
PART C . Do the survey results reveal a greater dislike for brownies or cupcakes? Justify your answer.
PLZZZ HELP

Answers: 1


Other questions on the subject: Mathematics
Mathematics, 21.06.2019 16:30, xxaurorabluexx
If g(x) is an odd function, which function must be an even function?
Answers: 3
Mathematics, 22.06.2019 02:00, mathhelppls14
1. the manager of collins import autos believes the number of cars sold in a day (q) depends on two factors: (1) the number of hours the dealership is open (h) and (2) the number of salespersons working that day (s). after collecting data for two months (53 days), the manager estimates the following log-linear model: q 4 equation 1 a. explain, how to transform the log-linear model into linear form that can be estimated using multiple regression analysis. the computer output for the multiple regression analysis is shown below: q4 table b. how do you interpret coefficients b and c? if the dealership increases the number of salespersons by 20%, what will be the percentage increase in daily sales? c. test the overall model for statistical significance at the 5% significance level. d. what percent of the total variation in daily auto sales is explained by this equation? what could you suggest to increase this percentage? e. test the intercept for statistical significance at the 5% level of significance. if h and s both equal 0, are sales expected to be 0? explain why or why not? f. test the estimated coefficient b for statistical significance. if the dealership decreases its hours of operation by 10%, what is the expected impact on daily sales?
Answers: 2
Mathematics, 22.06.2019 03:00, Alizerodriguez2010
Rectangle abcd is similar to rectangle rstu . what is the scale factor of a dilation from abcd to rstu ? enter your answer in the box.
Answers: 2
Mathematics, 22.06.2019 05:00, Elenegoggg
Me find the answer and explain the process to find the answer of the problem appreciate it : )
Answers: 1
You know the right answer?
A bakery did a survey among 100 customers to find their food preference . The customers were asked a...
Questions in other subjects:
Mathematics, 18.09.2019 15:30

Geography, 18.09.2019 15:30

English, 18.09.2019 15:30

Biology, 18.09.2019 15:30


Biology, 18.09.2019 15:30


