
Mathematics, 25.01.2021 22:10 anggar20
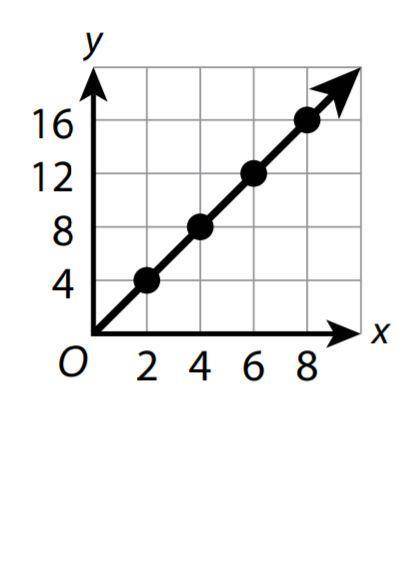
Which is the constant of proportionality for the relationship shown in the graph?
Look carefully at the scale shown on the x-axis and y-axis before choosing your answer.
A
1
B
2
C
3
D
4

Answers: 3


Other questions on the subject: Mathematics
Mathematics, 21.06.2019 15:00, Broov
Asap the total attendance for all of a baseball league in 2012 was about 7.5×10⁷ fans, while the attendance for the tornadoes in 2012 was about 1.5×10⁶ fans. about how many times more was the attendance for the entire baseball league than the attendance for just the tornadoes? 50 times more 10 times more 2 times more 5 times more
Answers: 2
Mathematics, 21.06.2019 18:00, xxaurorabluexx
Suppose you are going to graph the data in the table. minutes temperature (°c) 0 -2 1 1 2 3 3 4 4 5 5 -4 6 2 7 -3 what data should be represented on each axis, and what should the axis increments be? x-axis: minutes in increments of 1; y-axis: temperature in increments of 5 x-axis: temperature in increments of 5; y-axis: minutes in increments of 1 x-axis: minutes in increments of 1; y-axis: temperature in increments of 1 x-axis: temperature in increments of 1; y-axis: minutes in increments of 5
Answers: 2
Mathematics, 21.06.2019 20:30, ariannanykole1
What is the best approximation for the area of a circle with a radius of 4 m ? use 3.14 to approximate pi
Answers: 1
You know the right answer?
Which is the constant of proportionality for the relationship shown in the graph?
Look carefully at...
Questions in other subjects:
Mathematics, 06.05.2020 20:21

Arts, 06.05.2020 20:21


Mathematics, 06.05.2020 20:21


