
Mathematics, 25.01.2021 16:00 throwdown31
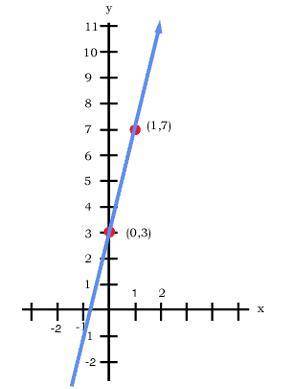
Follow the steps and write the equation represented by this graph.
Step 1: Write the general equation.
Step 2: Identify b, the Y intercept (x = 0) b=
Step 3: The second point from graph (x, y) P=
,
Step 4: Define m as ratio of rise / run m = rise /
Step 5: Put coordinates into ratio and get (7 -
) / (
- 0)
Step 6: Perform subtraction; get slope
/ 1
Step 7: Substitute values into y = mx + b
Step 8: Write answer y =
x +

Answers: 2


Other questions on the subject: Mathematics
Mathematics, 21.06.2019 14:00, brookeguilford
If benito is selecting samples of five values from the table, which row will result in the greatest mean? row 1 row 2 row 3 row 4
Answers: 2
Mathematics, 21.06.2019 14:30, emily41950
Every time you drive you will experience a combination of driving conditions and environments.
Answers: 1
Mathematics, 21.06.2019 16:00, andyyandere8765
Which is the graph of the piecewise function f(x)? f(x)=[tex]f(x) = \left \{ {{-x+1, x\leq 0 } \atop {x+1, x\ \textgreater \ 0}} \right.[/tex]
Answers: 3
You know the right answer?
Follow the steps and write the equation represented by this graph.
Step 1: Write the general equati...
Questions in other subjects:


History, 23.02.2021 20:20
English, 23.02.2021 20:20

English, 23.02.2021 20:20


