
Mathematics, 25.01.2021 05:20 asdfjk6421
Understand Statistics - Tutorial - Level
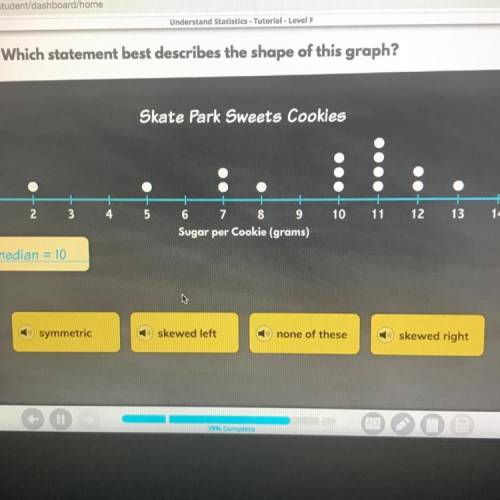
Which statement best describes the shape of this graph?
Skate Park Sweets Cookies
600+
1
2
3
4
5
10
11
13
12
14
6 7 8 9
Sugar per Cookie (grams)
median = 10
symmetric
skewed left
none of these
skewed right

Answers: 1


Other questions on the subject: Mathematics
Mathematics, 21.06.2019 17:40, PONBallfordM89
How can the correlation in the scatter plot graph below best be described? positive correlation negative correlation both positive and negative no correlation
Answers: 1
Mathematics, 21.06.2019 19:00, cheryljoseph69
Sanya noticed that the temperature was falling at a steady rate of 1.4 degrees every hour from the time that she first checked her outdoor thermometer. by 6 a. m., the temperature had fallen 21 degrees. which expression can you use to find how many hours earlier she had first checked the thermometer?
Answers: 3
You know the right answer?
Understand Statistics - Tutorial - Level
Which statement best describes the shape of this graph?
Questions in other subjects:

Mathematics, 20.08.2021 18:40
Mathematics, 20.08.2021 18:40

Geography, 20.08.2021 18:40


Chemistry, 20.08.2021 18:40

Mathematics, 20.08.2021 18:40


