
Mathematics, 24.01.2021 18:50 duhitzmay4693
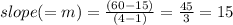
The graph below shows the height through which an elevator travels, y, in x seconds:
A graph is shown with x-axis title as Time in seconds. The title on the y-axis is Height of Elevator Above Ground in feet. The values on the x-axis are from 0 to 5 in increments of 1 for each grid line. The values on the y-axis are from 0 to 75 in increments of 15 for each grid line. A line is shown passing through the ordered pairs 1, 15 and 2, 30 and 3, 45 and 4, 60. The title of the graph is Rate of Ascent.
What is the rate of change for the relationship represented in the graph?
fraction 1 over 15
fraction 1 over 14
14
15

Answers: 3


Other questions on the subject: Mathematics
Mathematics, 21.06.2019 17:50, jamielytle
The length and width of a rectangle are consecutive even integers the area of the rectangle is 120 squares units what are the length and width of the rectangle
Answers: 1
Mathematics, 21.06.2019 18:00, lovemykay2355
If f(x) = 4x – 3 and g(x) = 8x + 2, find each function value a. f[g(3)] b. g[f(5)] c. g{f[g(-4)]}
Answers: 3
You know the right answer?
The graph below shows the height through which an elevator travels, y, in x seconds:
A graph is sho...
Questions in other subjects:
Mathematics, 30.09.2019 18:30


English, 30.09.2019 18:30


Biology, 30.09.2019 18:30

Chemistry, 30.09.2019 18:30
Mathematics, 30.09.2019 18:30


