
Mathematics, 24.01.2021 14:00 fernandoramirez086
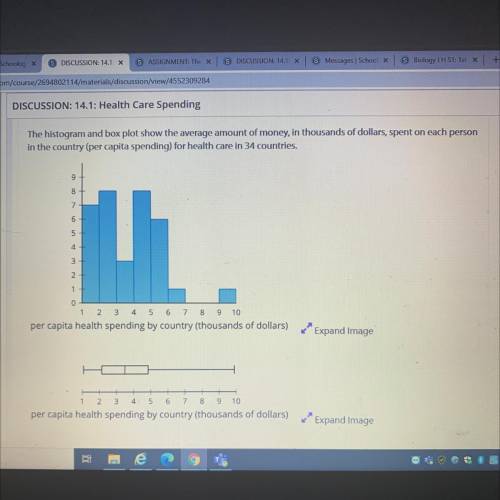
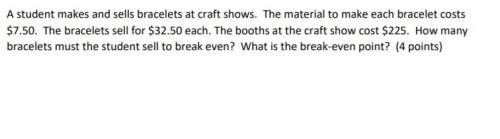
The histogram and box plot show the average amount of money, in thousands of dollars, spent on each person
in the country (per capita spending) for health care in 34 countries.
9
8
7
6
5
4
3
2
1 +
0
1 2 3 4 5 6 7 8 9 10
per capita health spending by country (thousands of dollars)
Expand Image
1
2.
3
4
5
6
7 8 9 10
per capita health spending by country (thousands of dollars)
Expand Image

Answers: 3


Other questions on the subject: Mathematics
Mathematics, 21.06.2019 20:00, PastryCrisp
The function f(x) = 14,600(1.1)* represents the population of a town x years after it was established. what was the original population of the town?
Answers: 1
Mathematics, 21.06.2019 20:30, cgarnett5408
Find the magnitude, correct to two decimal places, made by each of the following with positive direction of the x axis a) y= x the answer is 45° but i don’t know how
Answers: 2
You know the right answer?
The histogram and box plot show the average amount of money, in thousands of dollars, spent on each...
Questions in other subjects:

Mathematics, 12.12.2020 16:50
Health, 12.12.2020 16:50
Mathematics, 12.12.2020 16:50

Chemistry, 12.12.2020 16:50


