BOOKMARK
CHECK ANSWER
8
This graph shows how the total distance Jack has walked depends...

Mathematics, 23.01.2021 06:30 SavyBreyer
BOOKMARK
CHECK ANSWER
8
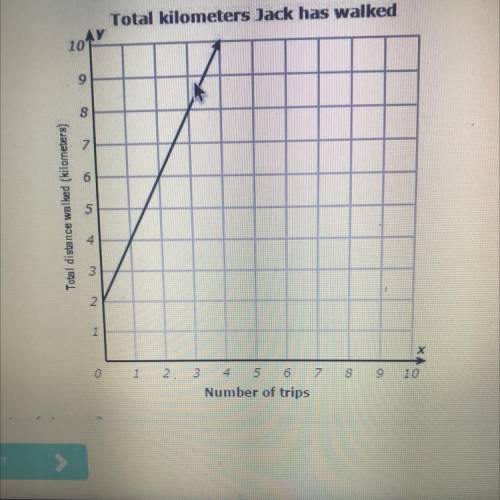
This graph shows how the total distance Jack has walked depends on the number of trips he has made to school.
Total kilometers Jack has walked
2042
9 8
N
Total distance walked (kilometers)
N
1
х
8
9 10
0 1 2 3 5 6 7
Number of trips
NEXT

Answers: 3


Other questions on the subject: Mathematics
Mathematics, 21.06.2019 14:00, zariasimone2
What is the slope of a line that is perpendicular to y = 3x + 1
Answers: 1
Mathematics, 21.06.2019 18:40, calebhoover03
2people are trying different phones to see which one has the better talk time. chatlong has an average of 18 hours with a standard deviation of 2 hours and talk-a-lot has an average of 20 hours with a standard deviation of 3. the two people who tested their phones both got 20 hours of use on their phones. for the z-scores i got 1 for the chatlong company and 0 for talk-a-lot. what is the percentile for each z-score?
Answers: 1
Mathematics, 21.06.2019 19:30, SMURFETTE86
Identify the number 127 as a rational or irrational. explain
Answers: 2
You know the right answer?
Questions in other subjects:

Mathematics, 27.08.2020 20:01
Mathematics, 27.08.2020 20:01
Mathematics, 27.08.2020 20:01
English, 27.08.2020 20:01


Computers and Technology, 27.08.2020 20:01


