
Mathematics, 22.01.2021 22:30 hdjsjfjruejchhehd
HELP ASAP
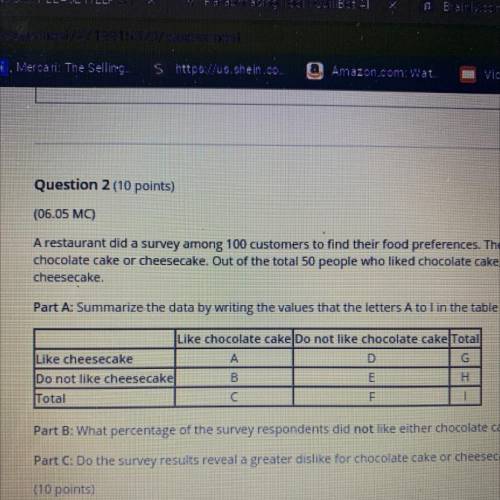
A restaurant did a survey among 100 customers to find their food preferences. The customers were asked about their preferences for
chocolate cake or cheesecake. Out of the total 50 people who liked chocolate cake, 15 also liked cheesecake. There were 25 people who liked
cheesecake
Part A: Summarize the data by writing the values that the letters A to l in the table below represent. (5 points)
Part B: What percentage of the survey respondents did not like either chocolate cake or cheesecake? (3 points)
Part C: Do the survey results reveal a greater dislike for chocolate cake or cheesecake? Justify your answer. (2 points)

Answers: 3


Other questions on the subject: Mathematics
Mathematics, 21.06.2019 16:50, mrhortert540
The parabola x = y² - 9 opens: a.)up b.)down c.) right d.)left
Answers: 1
You know the right answer?
HELP ASAP
A restaurant did a survey among 100 customers to find their food preferences. The custome...
Questions in other subjects:
Mathematics, 26.02.2020 17:42

Biology, 26.02.2020 17:42
Biology, 26.02.2020 17:42

Mathematics, 26.02.2020 17:43


