Mathematics, 21.01.2021 23:30 justalittle
The scatter plot shows the relationship between annual salary and years of experience. What is the range of the cluster shown in
the scatter plot?
A
A)
1 to 15 years of experience
B)
8 to 12 years of experience
$10,000 to $90,000 annual salary
D)
$40,000 to $60,000 annual salary

Answers: 1


Other questions on the subject: Mathematics

Mathematics, 21.06.2019 15:00, rosezgomez97
The radical equation 2+√2x-3 = √x+7 has a solution set [x= a0} and an extraneous root x = a1.
Answers: 3

Mathematics, 21.06.2019 19:00, Marleneg
An energy drink company claims that its product increases students' memory levels. to support its claims, the company issues advertisements claiming that 8 out of 10 people (chosen randomly from across the country) who tried their product reported improved memory. the missing component in this study is a .
Answers: 1

Mathematics, 21.06.2019 19:50, leximae2186
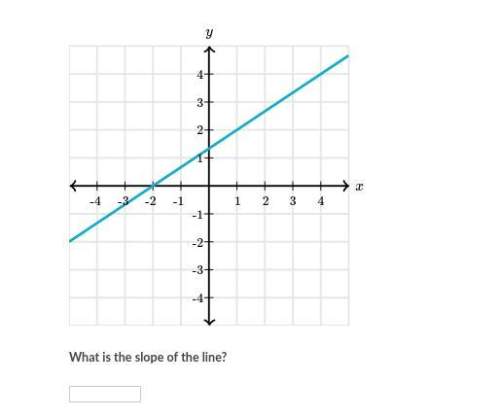
The graph shows the distance kerri drives on a trip. what is kerri's speed?
Answers: 3

Mathematics, 21.06.2019 22:00, jasmineanitak16
Using inductive reasoning, what is the next two numbers in this set? 1,-7,13,-19 i got the numbers 14,-26 is that right?
Answers: 2
You know the right answer?
The scatter plot shows the relationship between annual salary and years of experience. What is the r...
Questions in other subjects:

Mathematics, 23.03.2020 19:53


Biology, 23.03.2020 19:54

Mathematics, 23.03.2020 19:54


Chemistry, 23.03.2020 19:54


