
Mathematics, 21.01.2021 22:00 yayrocks2395
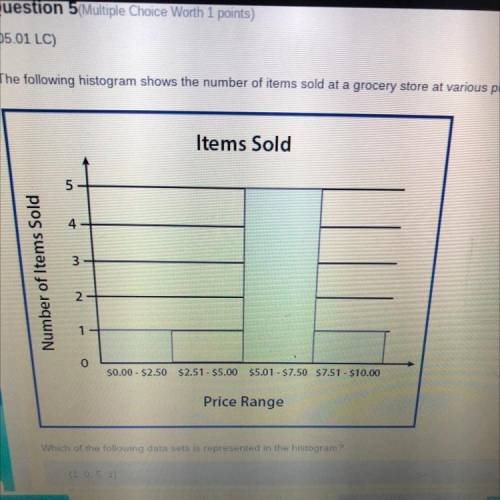
The following histogram shows the number of items sold at a grocery store at various prices:
Items Sold
5
4
3
Number of Items Sold
2.
2
1
0
$0.00 - $2.50 $2.51 - $5.00 $5.01 - $7.50 $7.51 - $10.00
Price Range
Which of the following data sets is represented in the histogram?

Answers: 2


Other questions on the subject: Mathematics
You know the right answer?
The following histogram shows the number of items sold at a grocery store at various prices:
Items...
Questions in other subjects:


World Languages, 05.11.2020 04:00

English, 05.11.2020 04:00

Health, 05.11.2020 04:00
Medicine, 05.11.2020 04:00
English, 05.11.2020 04:00


