
Mathematics, 21.01.2021 21:50 itscheesycheedar
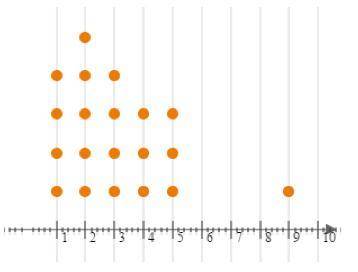
The data for numbers of times per week 20 students at Stackamole High eat vegetables are shown below:
Part A: Describe the dotplot.
Part B: What, if any, are the outliers in these data? Show your work.
Part C: What is the best measure of center for these data? Explain your reasoning.

Answers: 2


Other questions on the subject: Mathematics
Mathematics, 21.06.2019 20:50, HOBA6
Afarmer has a large field that is x feet in length. he wants to fence in a rectangular section in the middle of the field , leaving a length of 100 feet of open field behind each end of the fenced rectangle. he also wants the width of the fenced-in space to be 100 feet less than its length. find the expressions to represent the length and width of the fenced section of the field
Answers: 2
Mathematics, 21.06.2019 21:10, madisontrosclair2
Plot a point at the y-intercept of the following function on the provided graph. 3y=-5x+7 20 points
Answers: 1
Mathematics, 21.06.2019 23:40, redhot12352
For a science project, a high school research team conducted a survey of local air temperatures. based on the results of the survey, the found that the average temperatures were around 10 degrees higher than expected. this result was wrong. the trouble with the survey was that most of the locations were exposed to direct sunlight and located over asphalt or sand, which resulted in higher temperatures than normal. this is a classic example of an error in which phase of inferential statistics?
Answers: 1
You know the right answer?
The data for numbers of times per week 20 students at Stackamole High eat vegetables are shown below...
Questions in other subjects:

Health, 26.10.2021 23:40

Physics, 26.10.2021 23:40


Mathematics, 26.10.2021 23:40
Mathematics, 26.10.2021 23:40


