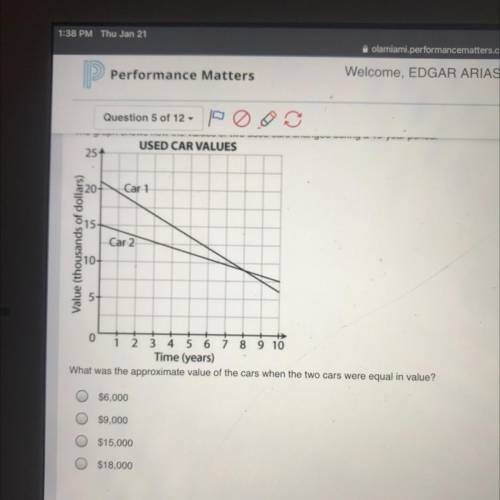
The graph shows how the values of two used cars changed during a 10 year period?
...

Mathematics, 21.01.2021 21:50 melanyrivera776
The graph shows how the values of two used cars changed during a 10 year period?

Answers: 2


Other questions on the subject: Mathematics
Mathematics, 21.06.2019 18:40, icantspeakengles
Does the point (1, sqrt 7) lie on circle shown.
Answers: 1
Mathematics, 21.06.2019 19:30, monnicawilliam
In the geometric progression –3, 12, −48… what term is 3,072?
Answers: 2
Mathematics, 22.06.2019 01:30, lyndah15
Here are the 30 best lifetime baseball batting averages of all time, arranged in order from lowest to highest: 0.319, 0.329, 0.330, 0.331, 0.331, 0.333, 0.333, 0.333, 0.334, 0.334, 0.334, 0.336, 0.337, 0.338, 0.338, 0.338, 0.340, 0.340, 0.341, 0.341, 0.342, 0.342, 0.342, 0.344, 0.344, 0.345, 0.346, 0.349, 0.358, 0.366 if you were to build a histogram of these data, which of the following would be the best choice of classes?
Answers: 3
Mathematics, 22.06.2019 01:50, salsa456
Anew movie is released each year for 14 years to go along with a popular book series. each movie is 2 minutes longer than the last to go along with a plot twist. the first movie is 70 minutes long. use an arithmetic series formula to determine the total length of all 14 movies
Answers: 3
You know the right answer?
Questions in other subjects:
Mathematics, 04.03.2021 05:20


English, 04.03.2021 05:20

Mathematics, 04.03.2021 05:20


