
Mathematics, 21.01.2021 21:00 iBrain
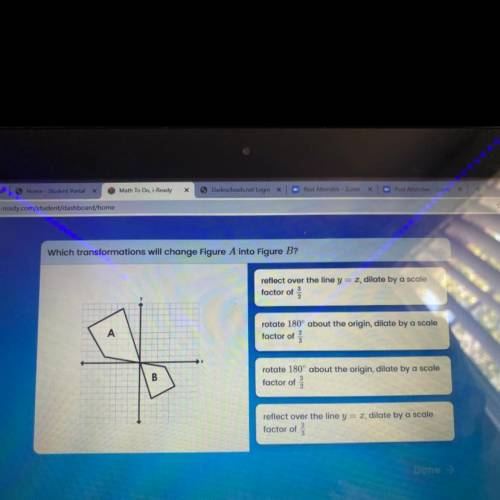
Which transformations will change Figure A into Figure B?
reflect over the line y = r, dilate by a scale
factor of
A
rotate 180° about the origin, dilate by a scale
factor of
B
rotate 180° about the origin, dilate by a scale
factor of 을
reflect over the line y = r, dilate by a scale
factor of
Done

Answers: 1


Other questions on the subject: Mathematics
Mathematics, 21.06.2019 18:30, AgentPangolin
If, while training for a marathon, you ran 60 miles in 2/3 months, how many miles did you run each month? (assume you ran the same amount each month) write your answer as a whole number, proper fraction, or mixed number in simplest form. you ran __ miles each month.
Answers: 1
Mathematics, 21.06.2019 19:00, vince022503
At $1.32 million, they closed last month percent above what they paid in 2007." how much did they pay in 2007?
Answers: 1
Mathematics, 21.06.2019 19:00, coryowens44
Write a fraction less than 1, which has a denominator of 6 and is greater than 3/4 plz answer !
Answers: 1
Mathematics, 22.06.2019 02:00, mathhelppls14
1. the manager of collins import autos believes the number of cars sold in a day (q) depends on two factors: (1) the number of hours the dealership is open (h) and (2) the number of salespersons working that day (s). after collecting data for two months (53 days), the manager estimates the following log-linear model: q 4 equation 1 a. explain, how to transform the log-linear model into linear form that can be estimated using multiple regression analysis. the computer output for the multiple regression analysis is shown below: q4 table b. how do you interpret coefficients b and c? if the dealership increases the number of salespersons by 20%, what will be the percentage increase in daily sales? c. test the overall model for statistical significance at the 5% significance level. d. what percent of the total variation in daily auto sales is explained by this equation? what could you suggest to increase this percentage? e. test the intercept for statistical significance at the 5% level of significance. if h and s both equal 0, are sales expected to be 0? explain why or why not? f. test the estimated coefficient b for statistical significance. if the dealership decreases its hours of operation by 10%, what is the expected impact on daily sales?
Answers: 2
You know the right answer?
Which transformations will change Figure A into Figure B?
reflect over the line y = r, dilate by a...
Questions in other subjects:


Business, 24.07.2019 13:30


Mathematics, 24.07.2019 13:30
Mathematics, 24.07.2019 13:30
Biology, 24.07.2019 13:30


