
Comparing Medians
A dot plot titled seventh grade test score.
Students in 7th grade took a s...

Mathematics, 21.01.2021 19:20 aubreywolfe2584
Comparing Medians
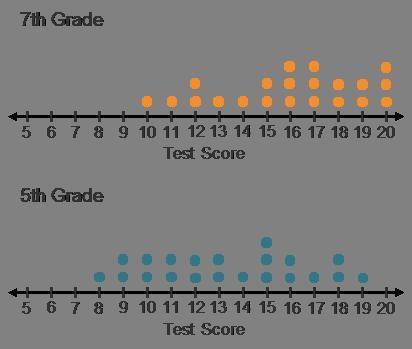
A dot plot titled seventh grade test score.
Students in 7th grade took a standardized math test that they also took in 5th grade. The results are shown on the dot plot, with the most recent data shown first.
Find and compare the medians.
7th-grade median:
5th-grade median:
What is the relationship between the medians?

Answers: 1


Other questions on the subject: Mathematics
Mathematics, 21.06.2019 20:00, gordon57
Someone answer asap for ! max recorded the heights of 500 male humans. he found that the heights were normally distributed around a mean of 177 centimeters. which statements about max’s data must be true? a. the median of max’s data is 250 b. more than half of the data points max recorded were 177 centimeters. c. a data point chosen at random is as likely to be above the mean as it is to be below the mean. d. every height within three standard deviations of the mean is equally likely to be chosen if a data point is selected at random.
Answers: 1
You know the right answer?
Questions in other subjects:

Mathematics, 26.01.2021 21:20


Biology, 26.01.2021 21:20

English, 26.01.2021 21:20

Mathematics, 26.01.2021 21:20
History, 26.01.2021 21:20


