
Mathematics, 21.01.2021 17:50 3000517
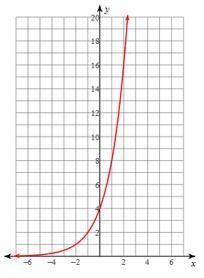
Given the graph below, which of the following best explains the range of the equation?
Question 2 options:
y 0, because the function comes close to zero but never touches it and goes infinitely in the positive direction.
y=0, because the function touches zero and goes infinitely in the positive direction.

Answers: 1


Other questions on the subject: Mathematics
Mathematics, 21.06.2019 17:00, jenn8055
Steve wants to develop a way to find the total cost of any item including sales tax. the sales tax in his city is 6%. his friend jenna writes the expression x + 6x where x is the cost of the item. explain whether her expression is correct based on the situation.
Answers: 1
Mathematics, 21.06.2019 18:30, yeet6942000
Complex numbers multiply √-4 * √-25 and show all intermediate steps. alternative notation is sqrt(-4) * sqrt(-25).
Answers: 1
Mathematics, 21.06.2019 18:30, BreBreDoeCCx
Solve the system of equations y= 3/2 - 1, -x+ y =-3
Answers: 1
You know the right answer?
Given the graph below, which of the following best explains the range of the equation?
Question 2 o...
Questions in other subjects:


