
Mathematics, 21.01.2021 16:50 Alexhall112
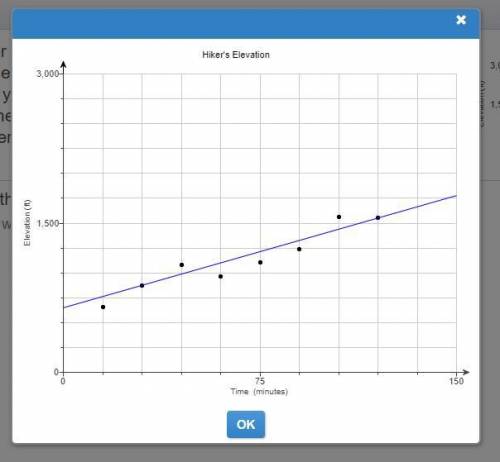
The scatter plot shows a hiker's elevation above sea level during a hike from the base to the top of a mountain. The equation of a trend line for the hiker's elevation is y=7.52x+649, where x represents the number of minutes and y represents the hiker's elevation in feet. Use the equation of the trend line to estimate the hiker's elevation after 170 minutes. After 170 minutes, the hiker's elevation will be about _ feet above sea level.

Answers: 3


Other questions on the subject: Mathematics
Mathematics, 21.06.2019 14:00, crispingolfer7082
What is the equation of the following graph in vertex form? parabolic function going down from the left through the point zero comma twelve and through the point two comma zero and turning at the point four comma negative four and going up through the point six comma zero and continuing towards infinity courtesy of texas instruments a: y = (x − 4)2 − 4 b: y = (x + 4)2 − 4 c: y = (x + 2)2 + 6 d: y = (x + 2)2 + 12
Answers: 1
Mathematics, 21.06.2019 16:00, ashley1460
Let the closed interval [a , b] be the domain of function f. the domain of f(x - 3) is given by (a) the open interval (a , b) (b) the closed interval [a , b] (c) the closed interval [a - 3 , b - 3] (d) the closed interval [a + 3 , b + 3]
Answers: 2
You know the right answer?
The scatter plot shows a hiker's elevation above sea level during a hike from the base to the top of...
Questions in other subjects:


Spanish, 23.05.2020 02:59

History, 23.05.2020 02:59
Chemistry, 23.05.2020 02:59


