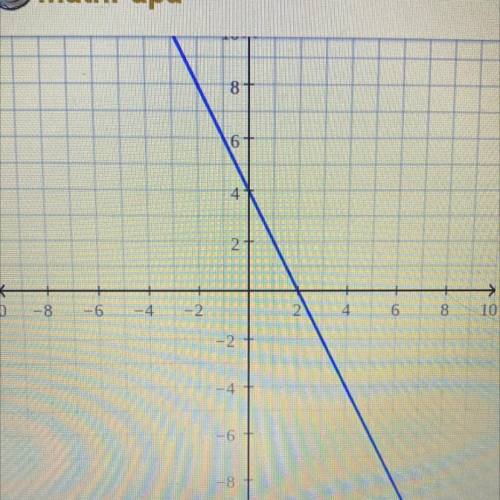
Draw the graph of the
linear equations 2x+y=4 for
values of x from -3 to +3...

Mathematics, 21.01.2021 14:00 lanakay2006
Draw the graph of the
linear equations 2x+y=4 for
values of x from -3 to +3

Answers: 2


Other questions on the subject: Mathematics
Mathematics, 21.06.2019 21:00, lunnar2003
Graph the system of inequalities presented here on your own paper, then use your graph to answer the following questions: y < 4x − 8 y is greater than or equal to negative 5 over 2 times x plus 5 part a: describe the graph of the system, including shading and the types of lines graphed. provide a description of the solution area. (6 points) part b: is the point (5, −8) included in the solution area for the system? justify your answer mathematically. (4 points)
Answers: 3
Mathematics, 21.06.2019 22:30, cramirezorozco392
Whit h equation best represents this situation the number 98 increased by an unknown number equal to 120
Answers: 1
You know the right answer?
Questions in other subjects:

History, 25.01.2020 06:31


German, 25.01.2020 06:31


Mathematics, 25.01.2020 06:31


