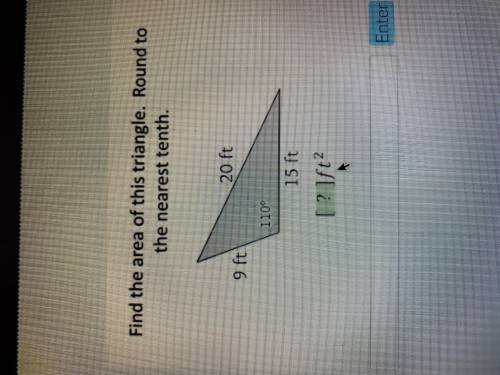
Find the area of this triangle. Round to the nearest tenth.
...

Mathematics, 21.01.2021 07:10 jackchris2732
Find the area of this triangle. Round to the nearest tenth.


Answers: 2


Other questions on the subject: Mathematics

Mathematics, 21.06.2019 16:00, amylumey2005
Leo has b boxes of pencils. each box contains 6 pencils. he has a total of 42 pencils. the equation that represents this situation the value of b that makes the equation true the first one is b+6=42,6b=42,b=42+6,or 42b=6 the second one are 7,836 48
Answers: 3


Mathematics, 22.06.2019 03:00, dominiqueallen23
Describe how the presence of possible outliers might be identified on the following. (a) histograms gap between the first bar and the rest of bars or between the last bar and the rest of bars large group of bars to the left or right of a gap higher center bar than surrounding bars gap around the center of the histogram higher far left or right bar than surrounding bars (b) dotplots large gap around the center of the data large gap between data on the far left side or the far right side and the rest of the data large groups of data to the left or right of a gap large group of data in the center of the dotplot large group of data on the left or right of the dotplot (c) stem-and-leaf displays several empty stems in the center of the stem-and-leaf display large group of data in stems on one of the far sides of the stem-and-leaf display large group of data near a gap several empty stems after stem including the lowest values or before stem including the highest values large group of data in the center stems (d) box-and-whisker plots data within the fences placed at q1 â’ 1.5(iqr) and at q3 + 1.5(iqr) data beyond the fences placed at q1 â’ 2(iqr) and at q3 + 2(iqr) data within the fences placed at q1 â’ 2(iqr) and at q3 + 2(iqr) data beyond the fences placed at q1 â’ 1.5(iqr) and at q3 + 1.5(iqr) data beyond the fences placed at q1 â’ 1(iqr) and at q3 + 1(iqr)
Answers: 1
You know the right answer?
Questions in other subjects:

World Languages, 09.10.2019 19:10


Biology, 09.10.2019 19:10


Computers and Technology, 09.10.2019 19:10


