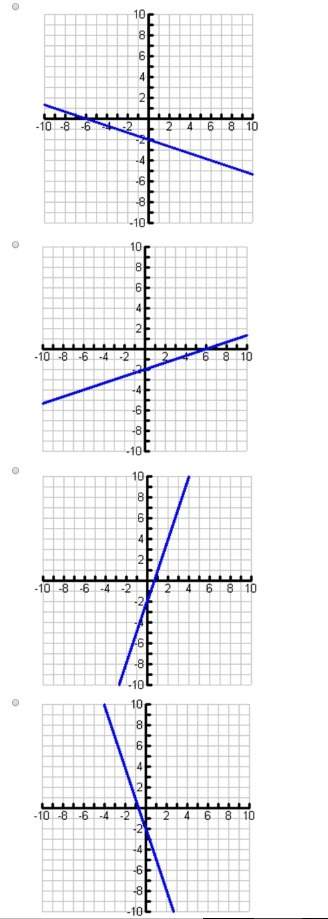
Which graph shows the solution to the system of linear inequalities?
y> 2/3x + 3
y<-1/3...

Mathematics, 20.01.2021 22:10 tmkyer2
Which graph shows the solution to the system of linear inequalities?
y> 2/3x + 3
y<-1/3x + 2

Answers: 2


Other questions on the subject: Mathematics
Mathematics, 21.06.2019 17:00, eazywalters
There is a spinner with 14 equal areas, numbered 1 through 14. if the spinner is spun one time, what is the probability that the result is a multiple of 2 or a multiple of 5?
Answers: 2
Mathematics, 21.06.2019 17:50, farhan61
(01.02 lc) angle abc has point e on ray ba and point d on ray bc. points e and d are equidistant from point b. to bisect angle abc, which of the following needs to be identified for the construction? the distance between points e and d the point in the angle that is equidistant from points e and d the endpoint of rays ba and bc the point outside of the angle that is equidistant from points e and d
Answers: 1
Mathematics, 21.06.2019 23:30, ivan2076
On this question. a hypothermia occurs when a person's body temperature drops below 95 degrees fahrenheit. write and solve an inequality that describes how much lower the body temperature of a person with hypothermia will be than the body temperature of a person with a normal temperature of 98.6 degrees fahrenheit
Answers: 1
You know the right answer?
Questions in other subjects:
Mathematics, 28.06.2021 06:00

Geography, 28.06.2021 06:00


Physics, 28.06.2021 06:00

Biology, 28.06.2021 06:00
Mathematics, 28.06.2021 06:00


