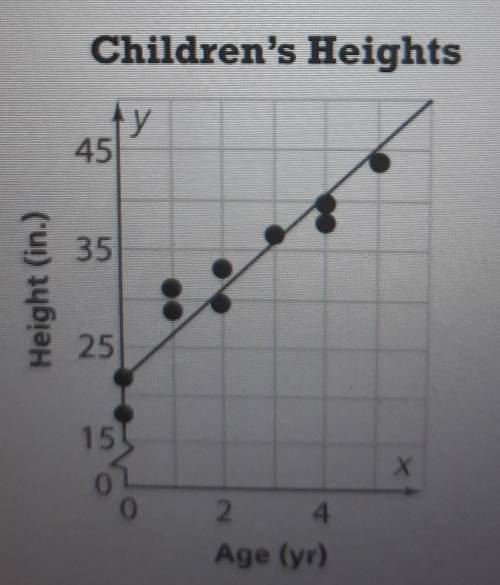
The scatter plot shows the average heights of children up to age 5.
Part A
Drag numbers to com...

Mathematics, 20.01.2021 02:00 gl648809
The scatter plot shows the average heights of children up to age 5.
Part A
Drag numbers to complete an equation for the trend line. Numbers may be used once, more than once, or not at all.
(22, 2.5, 18, 32, 4.5)
y = ?x + ?
Part B
Using the linear equation, predict the average height for a two-year old.
A. 15 inches
B. 22 inches
C. 31 inches
D. 35 inches

Answers: 3


Other questions on the subject: Mathematics
Mathematics, 21.06.2019 18:00, cheerthi16
Sandy is ordering bread rolls for her party, she wants 3/5 of the rolls to be whole wheat. what other factions can represent part of the rolls that will be whole wheat? shade the models to show your work.
Answers: 1
Mathematics, 21.06.2019 22:00, hannahpalmario
The customer price index(cpi), which measures the cost of a typical package of customer goods, was 208.8 in 2011 and 244.1 in 2016.let x=11 corresponding to the year 2011 an estimate to cpi into 2013 and 2014. assume that the data can be modeled by a straight line and the trend to continue idenfinitely. use data points to find such a line and then estimate the requested quantities
Answers: 1
Mathematics, 21.06.2019 22:30, ashleyrover11
(a. s."similarity in right triangles"solve for xa.) 10b.) 20c.) 14.5d.) [tex] 6\sqrt{3} [/tex]
Answers: 1
Mathematics, 21.06.2019 23:30, honwismun1127
Which statements are true about box plots? check all that apply. they describe sets of data. they include the mean. they show the data split into four parts. they show outliers through really short “whiskers.” each section of a box plot represents 25% of the data.
Answers: 3
You know the right answer?
Questions in other subjects:
Mathematics, 12.12.2020 16:10


Mathematics, 12.12.2020 16:10
History, 12.12.2020 16:10
Mathematics, 12.12.2020 16:10

Social Studies, 12.12.2020 16:10


