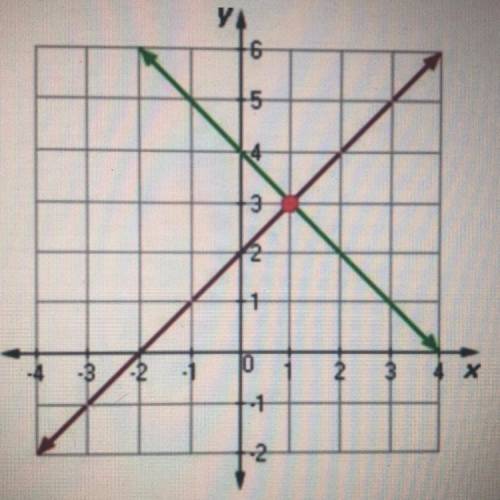
Write the system of equations that best represent this graph in any form and find the
solution...

Mathematics, 20.01.2021 01:00 rainbowstyles4461
Write the system of equations that best represent this graph in any form and find the
solution.

Answers: 3


Other questions on the subject: Mathematics
Mathematics, 20.06.2019 18:02, roro67
Anew fountain in the shape of a hexagon will have 6 sides of equal length. on a scale drawing, the coordinates of the vertices of the fountain are: (7.5,5), (11.5,2), (7.5,−1), (2.5,−1), (−1.5,2), and (2.5,5). how long is each side of the fountain?
Answers: 3
Mathematics, 21.06.2019 17:00, angeleyes42
When only separate discreet points are graphed it is called?
Answers: 1
Mathematics, 22.06.2019 00:50, katlyn10289
Margie is practicing for an upcoming tennis tournament. her first serve is good 20 out of 30 times on average. margie wants to know the estimated probability that her first serve will be good at least four of the next six times she serves. how could she design a simulation for this scenario?
Answers: 3
Mathematics, 22.06.2019 02:00, mathhelppls14
1. the manager of collins import autos believes the number of cars sold in a day (q) depends on two factors: (1) the number of hours the dealership is open (h) and (2) the number of salespersons working that day (s). after collecting data for two months (53 days), the manager estimates the following log-linear model: q 4 equation 1 a. explain, how to transform the log-linear model into linear form that can be estimated using multiple regression analysis. the computer output for the multiple regression analysis is shown below: q4 table b. how do you interpret coefficients b and c? if the dealership increases the number of salespersons by 20%, what will be the percentage increase in daily sales? c. test the overall model for statistical significance at the 5% significance level. d. what percent of the total variation in daily auto sales is explained by this equation? what could you suggest to increase this percentage? e. test the intercept for statistical significance at the 5% level of significance. if h and s both equal 0, are sales expected to be 0? explain why or why not? f. test the estimated coefficient b for statistical significance. if the dealership decreases its hours of operation by 10%, what is the expected impact on daily sales?
Answers: 2
You know the right answer?
Questions in other subjects:

Mathematics, 24.03.2020 01:00
Mathematics, 24.03.2020 01:00


