
Mathematics, 19.01.2021 17:20 aeverettpdzrvo
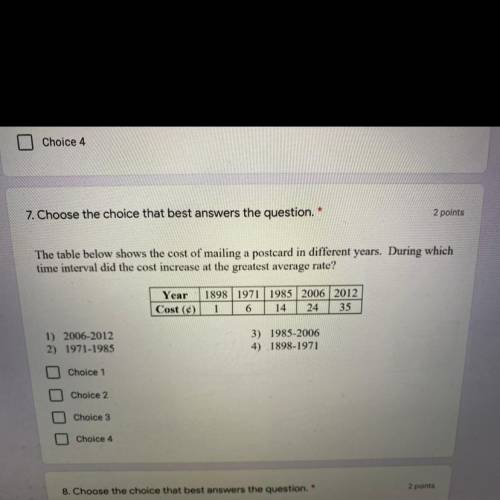
The table below shows the cost of mailing a postcard in different years. During which
time interval did the cost increase at the greatest average rate?
Year
Cost (4)
1898 | 1971 | 1985 2006 2012
1 6 14 24 35
1) 2006-2012
2) 1971-1985
3) 1985-2006
4) 1898-1971

Answers: 1


Other questions on the subject: Mathematics
Mathematics, 21.06.2019 18:50, anthonylemus36
Jermaine has t subway tokens. karen has 4 more subway tokens than jermaine. raul has 5 fewer subway tokens than jermaine. which expression represents the ratio of karen's tokens to raul's tokens
Answers: 1
You know the right answer?
The table below shows the cost of mailing a postcard in different years. During which
time interval...
Questions in other subjects:
Mathematics, 10.09.2020 16:01

Biology, 10.09.2020 16:01
Mathematics, 10.09.2020 16:01
Mathematics, 10.09.2020 16:01
Mathematics, 10.09.2020 16:01
Mathematics, 10.09.2020 16:01
Mathematics, 10.09.2020 16:01
Mathematics, 10.09.2020 16:01

English, 10.09.2020 16:01
Mathematics, 10.09.2020 16:01


