
Mathematics, 19.01.2021 02:10 babyskitt
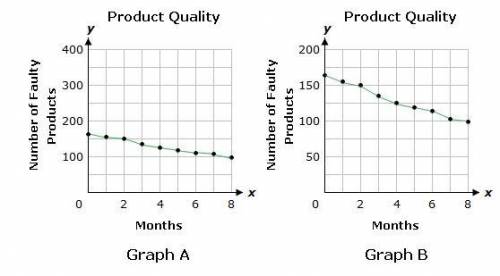
The graphs below show the number of faulty products, y, produced by a company for the first eight months since production started. Both graphs show the same information.
To support her discussion, it would be best for Alex to use _ for her presentation.
Alex should use this graph for her presentation because the number of faulty products _ on this graph.

Answers: 3


Other questions on the subject: Mathematics
Mathematics, 21.06.2019 15:50, COOLIOMARIS
Do a swot analysis for the business idea you chose in question 2 above. describe at least 2 strengths, 2 weaknesses, 2 opportunities, and 2 threats for that company idea. (1-8 sentences. 4.0 points)
Answers: 1
Mathematics, 21.06.2019 20:30, faizanaj1192
Raymond just got done jumping at super bounce trampoline center. the total cost of his session was $43.25 . he had to pay a $7 entrance fee and $1.25 for every minute he was on the trampoline. write an equation to determine the number of minutes (t) that raymond was on the trampoline.
Answers: 1
Mathematics, 21.06.2019 23:00, jetblackcap
Perry observes the opposite parallel walls of a room in how many lines do the plains containing the walls intersect
Answers: 1
Mathematics, 21.06.2019 23:30, fireemblam101ovu1gt
An engineer scale model shows a building that is 3 inches tall. if the scale is 1 inch = 600 feet, how tall is the actual building?
Answers: 3
You know the right answer?
The graphs below show the number of faulty products, y, produced by a company for the first eight mo...
Questions in other subjects:
Mathematics, 02.08.2019 07:30

Spanish, 02.08.2019 07:30

Mathematics, 02.08.2019 07:30


