
Mathematics, 18.01.2021 19:20 nsutton9985
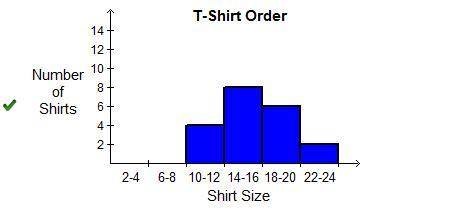
The dot plot represents an order of varying shirt sizes.
A number line going from 8 to 26. 0 dots are above 8. 1 dot is above 10. 3 dots are above 12. 3 dots are above 14. 5 dots are above 16. 4 dots are above 18. 2 dots are above 20. 1 dot is above 22. 1 dot is above 24. 0 dots are above 26.
Which histogram represents the same data?
A graph shows shirt size labeled 2 to 3 thru 22 to 24 on the horizontal axis and number of shirts on the vertical axis. 0 shirts are size 2 to 3. 0 shirts are size 6 to 8. 4 shirts are size 10 to 12. 11 shirts are size 14 to 16. 12 shirts are size 18 to 20. 8 shirts are size 22 to 24.
A graph shows shirt size labeled 2 to 3 thru 22 to 24 on the horizontal axis and number of shirts on the vertical axis. 0 shirts are size 2 to 3. 0 shirts are size 6 to 8. 11 shirts are size 10 to 12. 11 shirts are size 14 to 16. 12 shirts are size 18 to 20. 8 shirts are size 22 to 24.
A graph shows shirt size labeled 2 to 3 thru 22 to 24 on the horizontal axis and number of shirts on the vertical axis. 0 shirts are size 2 to 3. 0 shirts are size 6 to 8. 4 shirts are size 10 to 12. 8 shirts are size 14 to 16. 6 shirts are size 18 to 20. 2 shirts are size 22 to 24.
A number line going from 1 to 13. 0 dots are above 1. 2 dots are above 2. 1 dot is above 3. 0 dots are above 4. 0 dots are above 5. 0 dots are above 6. 2 dots are above 7. 3 dots are above 8. 0 dots are above 9. 0 dots are above 10. 4 dots are above 11. 3. dots are above 12. 0 dots are above 13.

Answers: 1


Other questions on the subject: Mathematics
Mathematics, 21.06.2019 21:40, dededese2403
Astudy was interested in determining if eating milk chocolate lowered someone's cholesterol levels. ten people's cholesterol was measured. then, each of these individuals were told to eat 100g of milk chocolate every day and to eat as they normally did. after two weeks, their cholesterol levels were measured again. is there evidence to support that their cholesterol levels went down? how should we write the alternative hypothesis? (mud = the population mean difference= before - after)a. ha: mud = 0b. ha: mud > 0c. ha: mud < 0d. ha: mud does not equal 0
Answers: 1
Mathematics, 21.06.2019 22:30, tiannaetzel
Which of the following is an example of a rational number? a. π b. √ 9 c. √ 8 d. 3.8362319
Answers: 1
You know the right answer?
The dot plot represents an order of varying shirt sizes.
A number line going from 8 to 26. 0 dots a...
Questions in other subjects:


Mathematics, 22.09.2020 09:01

Biology, 22.09.2020 09:01


Social Studies, 22.09.2020 09:01


