
Mathematics, 18.01.2021 01:40 ChanceJ
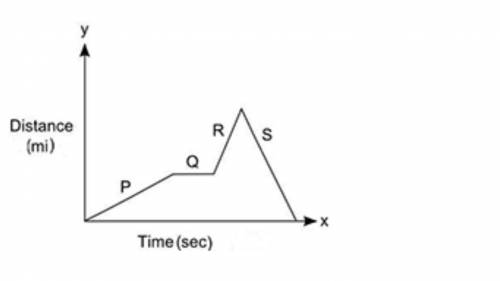
The graph shows the distance Maria traveled from home in miles (y) as a function of time in seconds (x). Image is down below:
Which segment shows Maria waiting for a cab? (5 points)
P
Q
R
S

Answers: 3


Other questions on the subject: Mathematics
Mathematics, 21.06.2019 20:00, songulakabulut1992
Maurice has 54 fewer comic books than rebecca. they have 130 comic books together .how many comic books are in maurices collection ? how many comic books are in rebeccas collection
Answers: 1
Mathematics, 21.06.2019 20:50, badatmathmate8388
Write the equation in logarithmic form e^x=403.429
Answers: 1
You know the right answer?
The graph shows the distance Maria traveled from home in miles (y) as a function of time in seconds...
Questions in other subjects:
Mathematics, 26.04.2021 22:10

Mathematics, 26.04.2021 22:10
Mathematics, 26.04.2021 22:10


