The dot plot shows the number of hours students in the
band practiced their instruments.
Whic...

Mathematics, 17.01.2021 09:00 quinnie48
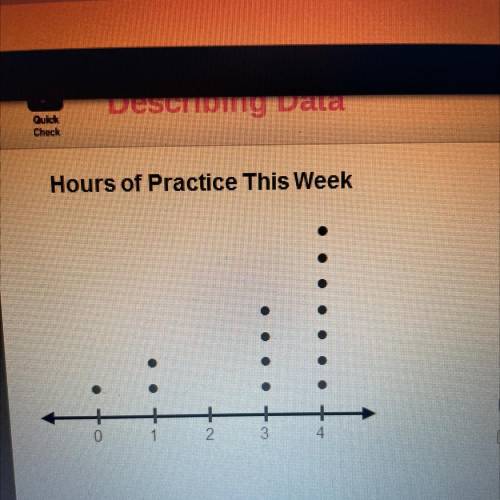
The dot plot shows the number of hours students in the
band practiced their instruments.
Which describe the dot plot? Select all that apply.
O There is a cluster from 3 to 4.
O There is a gap between 1 and 3.
There is a peak at 4.
O The data shows symmetry.
O The data is skewed left.
The data is skewed right.

Answers: 1


Other questions on the subject: Mathematics
Mathematics, 21.06.2019 20:30, strawberrymochi390
What is the axis of symmetry of the function f(x)=-(x+ 9)(x-21)
Answers: 2
Mathematics, 21.06.2019 22:30, xandraeden32
Ingredient c: 1/4 cup for 2/3 serving or ingredient d: 1/3 cup for 3/4 serving which unit rate is smaller
Answers: 2
Mathematics, 21.06.2019 23:50, levigabehart
Apolynomial has two terms. check all of the factoring methods that should be considered. common factor difference of cubes sum of cubes difference of squares perfect-square trinomial factoring by grouping
Answers: 3
You know the right answer?
Questions in other subjects:
Mathematics, 04.11.2019 12:31

Social Studies, 04.11.2019 12:31

Mathematics, 04.11.2019 12:31
Mathematics, 04.11.2019 12:31


Chemistry, 04.11.2019 12:31
Biology, 04.11.2019 12:31


