The graph shown corresponds to someone who makes
A. $10 a day
B. $5 a day
C. $10 an hou...

Mathematics, 16.01.2021 09:20 yoyo9661
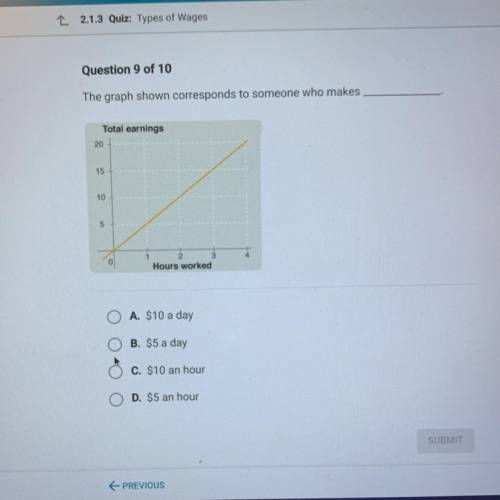
The graph shown corresponds to someone who makes
A. $10 a day
B. $5 a day
C. $10 an hour
D. $5 an hour

Answers: 3


Other questions on the subject: Mathematics
Mathematics, 22.06.2019 02:30, gracie0818
Last month, leonhard euler's watch kiosk at the mall had total sales of $9,489. merchandise totaling $225 was returned. the goods that were sold cost leonhard euler's $5,481. operating expenses for the moth were $992. what was the gross profit on sales?
Answers: 1
Mathematics, 22.06.2019 02:50, NetherisIsTheQueen
Aresearcher believes increased perceived control influence the well-being of residents at a nursing home. to test this , she allowed one group of residents to have control over their daily lies, (where to eat etc) . the other group of 5 residents had these deceisions made by staff. the resident's feelings of well-being were measured on a 10 point scale at the end of a one month trial period. is there a difference on well-being?
Answers: 2
You know the right answer?
Questions in other subjects:


Geography, 24.09.2019 06:50
Mathematics, 24.09.2019 06:50
Mathematics, 24.09.2019 06:50


Computers and Technology, 24.09.2019 06:50
Geography, 24.09.2019 06:50


