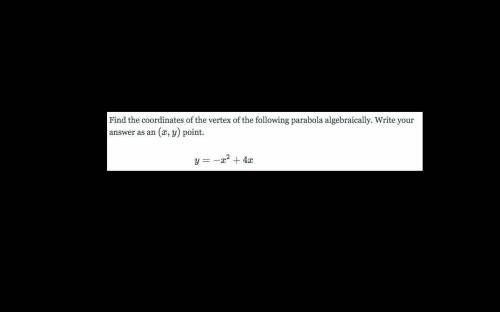
![[-\frac{b}{2a}, f(\frac{-b}{2a})]](/tpl/images/1041/4006/b3b95.png)

Please help me w this an explain how you got it!.
...

Mathematics, 16.01.2021 07:50 aris35
Please help me w this an explain how you got it!.

Answers: 2


Other questions on the subject: Mathematics
Mathematics, 21.06.2019 14:50, michelerin9486
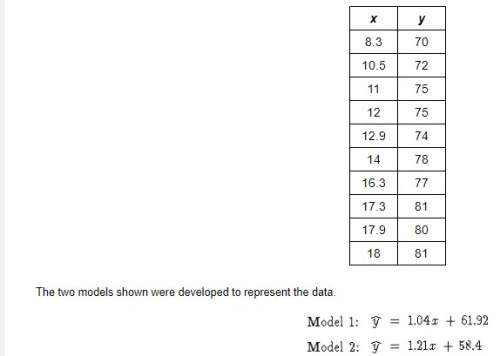
Which best describes the strength of the correlation, and what is true about the causation between the variables? it is a weak negative correlation, and it is not likely causal. it is a weak negative correlation, and it is likely causal. it is a strong negative correlation, and it is not likely causal. it is a strong negative correlation, and it is likely causal.
Answers: 1
Mathematics, 21.06.2019 21:40, avahrider1
The graph of f(x) = |x| is transformed to g(x) = |x + 11| - 7. on which interval is the function decreasing?
Answers: 3
You know the right answer?
Questions in other subjects:


