
Mathematics, 16.01.2021 06:20 adi593
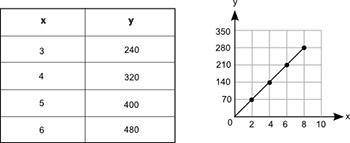
The table and the graph each show a different relationship between the same two variables, x and y:
How much more would the value of y be in the table, than its value on the graph, when x = 11?
Group of answer choices
110
170
385
495

Answers: 2


Other questions on the subject: Mathematics
Mathematics, 21.06.2019 17:40, challenggirl
Find the volume of the described solid. the solid lies between planes perpendicular to the x-axis at x = 0 and x=7. the cross sectionsperpendicular to the x-axis between these planes are squares whose bases run from the parabolay=-31x to the parabola y = 30/x. a) 441b) 147c) 864d) 882
Answers: 1
Mathematics, 21.06.2019 19:00, lex112592
Samantha is growing a garden in her back yard. she spend $90 setting up the garden bed and buying the proper garden supplies. in addition, each seed she plants cost $0.25. a. write the function f(x) that represents samantha's total cost on her garden. b. explain what x represents. c. explain what f(x) represents. d. if samantha plants 55 seeds, how much did she spend in total?
Answers: 2
Mathematics, 21.06.2019 19:30, ginocousins06
Fa bus driver leaves her first stop by 7: 00 a. m., her route will take less than 37 minutes. if she leaves after 7: 00 a. m., she estimates that the same route will take no less than 42 minutes. which inequality represents the time it takes to drive the route, r?
Answers: 3
You know the right answer?
The table and the graph each show a different relationship between the same two variables, x and y:...
Questions in other subjects:

Mathematics, 29.08.2020 01:01

History, 29.08.2020 01:01

Social Studies, 29.08.2020 01:01


Biology, 29.08.2020 01:01


