
Mathematics, 16.01.2021 03:30 P4thing
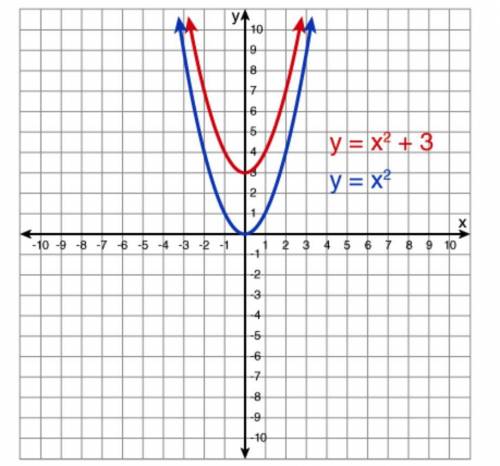
A quadratic function models the graph of a parabola. The quadratic functions, y = x2 and y = x2 + 3, are modeled in the graphs of the parabolas shown below.
Determine which situations best represent the scenario shown in the graph of the quadratic functions, y = x2 and y = x2 + 3. Select all that apply.
From x = -2 to x = 0, the average rate of change for both functions is negative
For the quadratic function, y = x2, the coordinate (2, 3) is a solution to the equation of the function.
The quadratic function, y = x2 + 3, has an x-intercept at the origin
The quadratic function, y = x2, has an x-intercept at the origin
From x = -2 to x = 0, the average rate of change for both functions is positive
For the quadratic function, y = x2 + 3, the coordinate (2, 7) is a solution to the equation of the function.

Answers: 1


Other questions on the subject: Mathematics
Mathematics, 21.06.2019 14:30, purpletart41
Arrange these numbers from least to greatest 3/5 5/7 2/9
Answers: 2
Mathematics, 21.06.2019 17:00, kaitlyn114433
Lisa has three classes that each last 50 minutes. what is the total number of minutes of the three classes
Answers: 1
Mathematics, 21.06.2019 18:30, yeet6942000
Complex numbers multiply √-4 * √-25 and show all intermediate steps. alternative notation is sqrt(-4) * sqrt(-25).
Answers: 1
You know the right answer?
A quadratic function models the graph of a parabola. The quadratic functions, y = x2 and y = x2 + 3,...
Questions in other subjects:

English, 23.04.2020 20:10
Mathematics, 23.04.2020 20:10

English, 23.04.2020 20:10

Mathematics, 23.04.2020 20:10


