
Mathematics, 15.01.2021 18:50 david3253
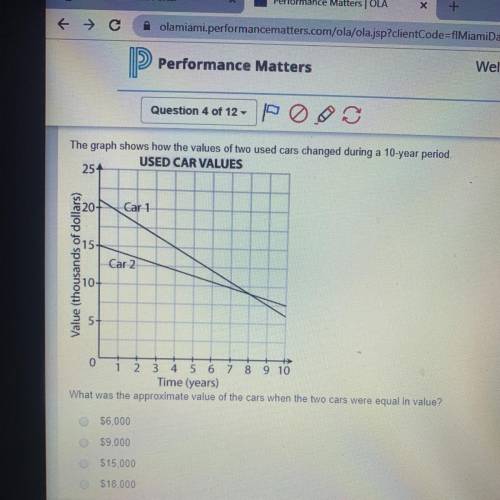
The graph shows how the values of two used cars changed during a 10-year period.
USED CAR VALUES
254
20
Car 1
Value (thousands of dollars)
Car 2
0
1 2 3 4 5 6 7 8 9 10
Time (years)
What was the approximate value of the cars when the two cars were equal in value?
$6.000
$9.000
$15.000
$18.000

Answers: 1


Other questions on the subject: Mathematics
Mathematics, 21.06.2019 19:00, anonymous115296
How many solutions does the nonlinear system of equations graphed bellow have?
Answers: 1
Mathematics, 21.06.2019 20:00, Abdirisack3250
How to find the exponential function y=ca^x, with points (1,2) and (2,1)
Answers: 2
You know the right answer?
The graph shows how the values of two used cars changed during a 10-year period.
USED CAR VALUES
Questions in other subjects:


Mathematics, 19.09.2019 19:50
Mathematics, 19.09.2019 19:50

English, 19.09.2019 19:50

Health, 19.09.2019 19:50

History, 19.09.2019 19:50


