
Mathematics, 15.01.2021 14:30 dessssimartinez6780
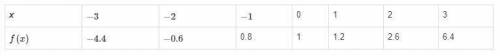
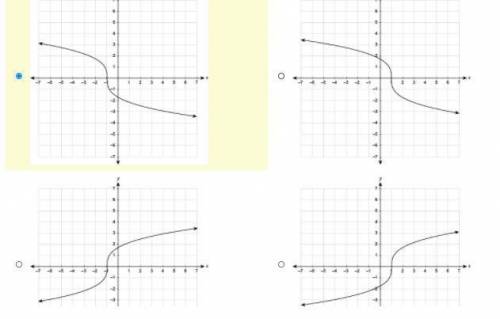
An invertible function is represented by the values in the table. Which graph shows the inverse of this function?

Answers: 3


Other questions on the subject: Mathematics
Mathematics, 21.06.2019 14:40, olivialaine31
Which graph represents the following piecewise defined function?
Answers: 2
Mathematics, 21.06.2019 16:00, bailey1025
5× 1/2 = ? a) more than 5 because you are multiplying by a whole number b) 5/10 because you multiply the numerator and denominator by 5 c) less than 5 because you are multiplying by a number that is more than 1 d) less than 5 because you are multiplying by a number that is less than 1
Answers: 3
Mathematics, 21.06.2019 19:00, chloebaby8
Find the equation of a line whose slope is 2/5 and y- intercept is 2.write your answer in the form 1) ax+by+c=02) x/a+y/b=1
Answers: 1
Mathematics, 21.06.2019 21:00, Abdullah1860
George is putting trim around his rectangular deck, including the gate. he will need 44 feet of trim to do the entire deck. if the deck is 13 feet long, how wide is the deck?
Answers: 2
You know the right answer?
An invertible function is represented by the values in the table.
Which graph shows the inverse of...
Questions in other subjects:
Mathematics, 13.10.2020 01:01
Mathematics, 13.10.2020 01:01


Business, 13.10.2020 01:01

Mathematics, 13.10.2020 01:01


